The Economics of Sport
  • Sports Economics
  • About
  • Workshop
  • Selected Publications
  • Book Reviews
  • A Primer on Gaelic Games
  • Upcoming Events
  • Media
  • Education
  • Resources & Links
  • Data

Frees awarded in All Ireland hurling finals

5/9/2014

0 Comments

 
By John Eakins

The All Ireland hurling final on Sunday once again sees Kilkenny and Tipperary facing each other in the latest edition of the age old rivalry. Over the next few days many different aspects of the game will be dissected by pundits and the ordinary public in an attempt to predict how the game will unfold. One which always generates debate, particularly in recent years is the role of the referee. Most GAA observers would prefer to have a referee who “lets the game flow” as this usually brings about a much more exciting game. Others suggest that this could favour the more physical team. When it comes to an All Ireland hurling final, small margins like this could matter. The famous interview between Marty Morrissey and Brian Cody after the 2009 All Ireland hurling final summarises these conflicting views quite well.
 
        MORRISSEY: "In terms of the referee, were you pleased overall? I'm sure you are now, considering you've won  the All-Ireland, but did you think he allowed a lot to go?"

        CODY: "Ah Marty, please, give me a break will you. The referee - we're supposed to say nothing about the referees. I make a habit of saying absolutely nothing about referees. Diarmuid Kirwan, I am certain in my head, was going out to be the very best he possibly could be. You seem to have had a problem with him; you tell me."

        MORRISSEY: "I had no problem with him, but it's obviously a point of debate after the game. In terms of ... "

        CODY: "I can't understand, Marty, how this discussion with me is turning into a debate about a referee. It started off about the four-in-a-row; now you want to talk about a referee, it sounds a bit silly.

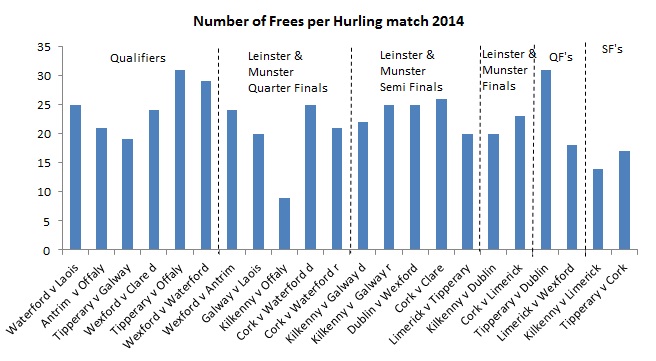
So what can we say about the role of referees. Well we can look at data on the number of frees awarded per game. The first graph below gives figures for all of the games played in this season’s hurling championship (excluding the opening round robin matches in Leinster and the replay between Wexford and Clare where the figures I collected included extra time). What is of interest here is whether fewer number of frees are given as we get toward the closing stages of the championship – perhaps where the pressure to “let the game flow” is at its greatest. There may be some evidence to suggest that this is happening although it is far from conclusive (we’d need more data on previous seasons). The average number of frees awarded for the Munster and Leinster Finals, the All Ireland Quarter finals and Semi finals was 20.5. In comparison, for all of the other provincial matches, the average was 21.7 (with the Kilkenny v Offaly game dragging this average down somewhat) and for all of the qualifiers, the average was 24.8.
Picture
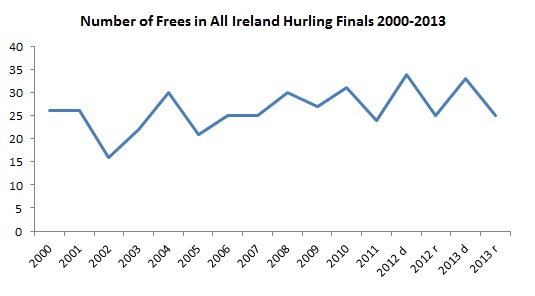
But what about the All-Ireland hurling final itself? The next graph shows the number of frees awarded in All-Ireland hurling finals from 2000 to 2013 (including the replay matches in the last two years). The average number of frees for this period is 26.3, which perhaps surprisingly is not toward the lower end of the range (in comparison to 2014 matches). And if we look at the trend in the data, the number of frees awarded is actually increasing slightly over time. So the perception of All Ireland hurling finals as being relatively "free-less" compared to other matches during the year may not be the case. One final note – the referee on Sunday, Barry Kelly, has referred three previous All-Ireland hurling finals, 2006, 2008 and the drawn 2012 match. The 2012 drawn final saw the highest number of frees awarded in the period from 2000-2013 (34) while the 2008 final is fourth on the list (30). The 2006 final is twelfth on the list (25). Given this I would expect something in the high 20’s once again on Sunday. Which team this will favour (if at all) is something we will just have to wait and see.
Picture
0 Comments

So why did Cork perform so badly in last weekend's Hurling semi-final?

23/8/2014

0 Comments

 
By John Eakins
There has much been much discussion as to the reasons why Cork performed so poorly against Tipperary last weekend. One factor frequently mentioned is the long lay-off that Cork had between the Munster Final and the Semi-Final (5 weeks). From what I have heard the debate seems to be split 50/50 with some saying that it’s too long a period to keep players’ minds focussed while others citing the fact that Kilkenny haven’t been affected to the same degree in previous seasons. The table below might perhaps give some further insight. It details the provincial winners in Munster and Leinster since the introduction of the‘back-door’ in 1997 and the number of weeks between playing the provincial final and the subsequent semi-final or quarter final (quarter finals were introduced in 2005 and lasted for 3 seasons). Those teams highlighted in red are ones who lost their subsequent semi-final or quarter final after playing a provincial final.

Picture
In the majority of cases, one of the provincial winners loses their next match (this happened 9 out of the 18 seasons). In 7 out of the 18 seasons, both provincial winners won their next match (although as explained in the footnote to the table, Kilkenny and Waterford lost semi-finals in two of these cases). In 2 out of the 18 seasons, both provincial winners lost their next match (2004 and 2013). So instances where provincial winners lose their next match occur more often than they don’t. There doesn’t appear to be any clear relationship between these figures and the number of week’s lay-off however. Even in 2010, Waterford had a shorter number of weeks compared to Kilkenny (due to a replay against Cork in the Munster final) and still lost their semi-final (to Tipperary). 

One interesting statistic from the table which could lead to a working hypothesis is the fact that 5 out of the last 7 Munster hurling winners have lost their subsequent semi-finals. In almost all of these cases, the Munster win was from a team who hadn’t won Munster in a number of years. For example, the 2008 Munster winners, Tipperary won their previous Munster title in 2001. There was a gap of 3 years between Waterford’s win in 2010 and their previous win. When Limerick won in 2013 it was their first Munster win in over 17 years while Cork’s win this year was their first in 8 years. In contrast, in Leinster, Kilkenny won 7 in a row between 2005 and 2011 and never lost their subsequent match that followed. When Dublin won the Leinster title in 2013 for the first time in 52 years they also lost their next match in the semi-final with Cork.

It’s only a hypothesis and there are a number of examples which run counter to it (Cork in 2000, Galway in 2012, Tipperary in 2012) but perhaps the effort that is put in and elation in winning a provincial title (particularly in the ultra-competitive Munster championship) for the first time in a number of years leave teams flat for the next match. This may be exacerbated by the long wait for that match. So perhaps a shorter time period between matches may work but only in tempering the joy of a provincial title and focusing minds on the next task quicker.
0 Comments

WASPs and Cricket

11/6/2014

1 Comment

 
Picture
By John Eakins

Those of you who are fans of cricket and particularly the ODI (One Day  International) and Twenty 20 limited overs versions may have noticed a new feature introduced by Sky Sports in their cricket coverage. Known as WASP or the Winning and Score Predictor, this statistical tool acts as a very simple way of tracking the outcome of the match. In essence it has two features, firstly predicting the total score of the team batting first and secondly predicting the chances of winning for the team batting second. The latter is given in terms of a percentage, so for example if the WASP equals 20%, then the team batting second has a 20% chance of winning at that point in the match.
 
I’m sure many of you are probably saying “so what?”, but Cricket is a game where, because of the way the scoring works, assessing who is winning at a point in the match can be very subjective. What is particularly interesting about the WASP (and what can add to the intrigue of the match) is that its value is recalculated ball by ball. So if a team batting second hits a six, the WASP percentage will increase whereas if the team loses a wicket, the WASP percentage will decrease. And as is often the case with run chases in cricket, a team’s chances of winning can fluctuate throughout the innings and potentially go from the very low to the very high (and vice versa) within a few balls.  

The other interesting feature about WASP is that it was developed by two economists at the University of Canterbury, Dr. Scott Brooker and Dr. Seamus Hogan. Brooker carried out the research as part of his PhD studies under the supervision of Dr. Hogan. A working paper on the subject can be found here. A less technical description of the underlying methodology and a set of frequently asked questions about WASP can be found here and here on a set of blog posts by Seamus Hogan. In these posts he makes the point that WASP is not a predictor of who is likely to win the game but rather a predictor of who is winning at a particular point during the match. He gives an example of a match involving Australia and Ireland. If Ireland bat second and get off to a great start, posting a lot of runs in the first couple of overs and not losing any wickets, the WASP score is likely to show them to be winning at that time. Most cricket observers (and bookmakers!) would still however have Australia as their favourites given their past performance. 
 
And this is essentially how WASP works. It takes data from past cricket matches and predicts who is winning if the two teams are playing on an average basis, that is, playing based on the average performance of a top-eight batting team against a top-eight bowling/fielding team. It doesn’t take into account the relative strengths or current form of the teams and players. So it’s not perfect but it does make for interesting viewing especially in tracking the progress of the WASP as the game progresses and in the final few overs of a close game when WASP values can change dramatically.

1 Comment

Survival Rates in the Premier League

16/5/2014

 
Picture
By John Eakins

On Saturday the 24th May, the richest game in club football will take place between Derby County and Queens Park Rangers to determine who will take the 3rd and last promotion place from the Championship to the Premier League. Leicester City as Champions and Burnley as runners up have already booked their places. But the question for many of their fans is how these promoted clubs will perform in the Premier League Since it was established in the 1992/93 season only twice has all three teams promoted managed to stay in the Premier League in the subsequent season, in 2001/02 and 2011/12. On one occasion all three teams promoted were relegated in the subsequent season, in 1997/98. On average over the seasons since 1992/93, at least 1 team has been relegated straight after being promoted – the actual average being equal to 1.27.

Picture
We can look into this story in some more detail by assessing the survival rate of promoted teams after the first season and beyond. (see here for a related blog by David Butler on the Myth of Second Season Syndrome). In total, 62 teams have been promoted to the Premier League since 1992/93 (in 1994/95 only two teams were promoted and four teams were relegated to reduce the size of the Premier League to 20 teams). The table below shows the number of seasons that these teams have survived in the Premier League. The analysis is complicated slightly by the fact that there are teams who have been promoted to the Premier League and have then been relegated and there are teams who have been promoted to the Premier League and have since stayed. Manchester City is a prime example of this having being promoted in 2001/02 and will enter their 13th season in the Premier League in August as Champions.

Picture
So 27 out of the 62 teams promoted have lasted only one season in the Premier League. 10 of the 62 teams promoted have lasted two seasons (figures which include Hull City and Crystal Palace who will spend a second successive season in the Premier League next year). It is noticeable that after the first two seasons the numbers fall significantly. Only 25 out of the 62 teams promoted last three seasons or more. Going further, only 7 out of the 62 teams promoted
last ten seasons or more in the Premier League. The figure below plots these survival rates (in proportionate terms) for the number of seasons in the Premier League.
Picture
One other interesting feature of the data is the fact that while 62 teams have been promoted to the Premier League since 1992/93, many of these are the same clubs. In all, 35 clubs have been promoted since 1992/93 which suggests that there are clubs which are getting relegated from the Premier League but who are subsequently returning later on. Crystal Palace has been relegated four times and promoted four times since 1992/93. Sunderland and West Brom have each been promoted four times and relegated three times. The‘boucebackability’ rate of clubs to the Premier League is something that I will look at once we know who has won the championship play-off.  

The Premier League 2013-2014 Review

14/5/2014

 
By David Butler

This entry is intended to recall a variety of articles written during the past year that considered the 'live' Premier League race and recaps on several of our suggestions and forecasts.

The curse of the prolific goal scorer, that was considered by Declan Jordan here and by John Eakins and myself consider here , has struck again for the Premier League. Only 8 times in the Premier League history did the top goal scorer play for the champions, Luis Suarez is added to a growing list of the cursed! 

In light of the  teams relegated and the issues of managerial change, Robbie Butler considered how effective altering the boss was here and again in April here, providing some wise advice. Declan Jordan addressed the extent to which Premier League clubs have been increasing the rate at which they change managers here, something which has seen growing attention as the Premier League managerial casualty list lenghtened over the course of 2013-2014 season.

Manchester United bucked the trend this season and didn’t challenge for the league after winning it, something which I showed was a rather rare occurrence historically in the Premier League here. In a poor season for the 2012-2013 champions, Robbie Butler and myself forecasted David Moyes' uphill challenge to qualify for the Champions League here last December. While on the subject of Champions League qualification, Everton were unlucky not to qualify for next years competition as they surpassed the crucial 70 points mark that Robbie Butler considered here, yet still failed to qualify for Europes elite competition.

The week before the start of the Premier League season Robbie Butler wrote a very interesting piece on how it may be 'darkest before the dawn' for Liverpool here.
 
An on running debate saw us consider whether defensive or offensive teams are more likely to win Championships. Declan Jordan used statistics form the League of Ireland here to consider the issue while John Eakins considered
European statistics here. I discussed the offensive side in January and showed how 70% of Premier League winners have scored the most goals  in the league (which is true of this season too) and used it to argue why goals scored offer a fast and frugal means to predict the eventual winners in light of a supercomputers complex estimates of the Premier League outcome. The supercomputer incorrectly predicted the winners but correctly predicted the relegated teams.

We all look forward to considering similar topics and new ones for the 2014-2015 Premier League!

Is the PFA Players' Player of the Year award a consolation prize?

3/5/2014

 
By John Eakins
On Sunday night Luis Suárez was awarded the 2013-2014 PFA Players' Player of the Year award for his displays and goal scoring exploits for Liverpool this season. The winner is chosen by a vote amongst the members of the players’ union, the Professional Footballers' Association (PFA). If you were asked to predict a winner at the start of the season, you probably would in the first instance suggest a player who will be part of the same year’s championship winning team. However looking back on previous winners of this prize it is interesting that many of them end up not being part of the same year’s championship winning team. Since it was first awarded in the 1973-1974 season only 18 out of the 40 winners have come from the team that has also won the top tier of the English league that year – see details below.
Picture
There are a couple of ways of trying to explain this. One limitation of the voting process that is often cited is the fact that players vote around the end of February/start of March before a substantial part of the season has been completed. Thus the form of the team that the player is part of (or even the player himself) could decline before the season finishes. Another explanation is that a player on a championship winning team may not stand out as much relative to a player on a team that finishes second, third, fourth etc., simply because they are part of a better all-round team. In other words the amount of goals scored, assists, passes, tackles, etc., are spread out across the team rather than one individual standing out.

However I wonder do players have a tendency to vote for a player who they think is not likely to be part of the championship winning team. As I already said above, one would initially think of players from the team that are favourites to win the league. But for those voting, perhaps they think that the prize of winning the league is enough  glory and the PFA award is therefore recognition for the best player outside of the likely winners of the league. I would suggest that this is more likely to occur in seasons when there isn’t an outstanding candidate. Other than the data above it is hard to test this theory but I’m sure Luis Suárez and Liverpool don’t want the trend to continue.

Golden Boots & League Champions

30/4/2014

 
By John Eakins & David Butler

Over coffee yesterday we chatted about the relationship between the top goal scorers in domestic leagues over a season and the title winners that year.  Somewhat to our surprise there is a weak relationship between the two. 

The data below shows the domestic league winners in England, Germany, Spain and Italy over 21 seasons (83 seasons in total and not 84 as in 2004/2005 there was no league winner in Italy) and the top domestic league scorer for each season. Earlier in the year Declan Jordan considered a similar topic here for the League of Ireland.

Only 28% of top goal scorers in each of the domestic league competitions played for the champions. It occurred 8 times in the Premier League and 7 times in Spain while only 5 and 3 times in Germany and Italy respectively. What’s more, of these 23 occurrences, the golden boot award was shared 5 times.   As John Eakins argues here this may be linked to the offensive and defensive philosophies associated with different European leagues.   

Having just one superstar seems important but may not be enough to win a league.
Picture

Cricket: To bat or not to bat – that is the question

27/3/2014

 
By John Eakins
Picture
Cricket has got its detractors mainly because it’s viewed as being a boring game with rules and terminology that are difficult to grasp. Not so however with Twenty20 cricket, a shorter version of the game that is easier to understand and more importantly is much more exciting (although cricket purists would probably argue differently).  In Twenty20 cricket each team bats for a maximum of 20 overs (an over consisting of 6 balls) with the winner being the team that posts the most runs. Because the objective is to score as much runs as possible in a limited amount of overs, a lot more happens in Twenty20 cricket compared to Test cricket and One Day International (ODI) cricket. In Twenty20 cricket there is a much higher scoring rate with more 4’s (a shot that reaches the boundary) and 6’s (a shot that clears the boundary), more wickets are taken and you also have closer and more exciting finishes. For some evidence of this you can look no further that the International Cricket Council (ICC) World Twenty20 that is currently taking place in Bangladesh. You can find highlights here.

One would wonder where the relationship between cricket and economics is but cricket can essentially be summed up as a game of strategy. You have the bowler and the batter who, similar to a penalty taker and goalkeeper, have to guess what each other’s strategies will be. There is also the captain’s strategy as to the best way to position his field in order to limit the amount of runs that the batsman can take or to try and get the batsman to make a shot that will get him out. Another interesting facet of the game is the toss at the beginning of the game between the two captains. The captain that wins the toss can decide to bat first or second. As opposed to most other the games, the toss in cricket is seen as an important determinant of the outcome of the game as factors such as the condition of the playing surface or even weather may give a distinct advantage to a team batting first or second. 
 
Recently published research in the Journal of Sports Economics by Abhinav Sacheti, Ian Gregory-Smith and David Paton (here) has looked at this in more detail using data from international Twenty20 cricket matches. Contrary to the perceived wisdom, they find little evidence to suggest that winning the toss or choosing to bat first improves the likelihood of winning. More interestingly however they argue that the captain’s choice after winning the toss may be influenced by social pressure resulting in incorrect judgements of how the game will play out. The “irrational behavior of captains may be because captains are making batting order choices that shield them from media criticism” pg 17. They further suggest that a potential cause of this irrational behaviour is the competitive nature of international cricket matches and thus paradoxically if competition is reduced more rational behaviour could be created. They also make the analogy between this and the decisions made by stock market investors and corporate managers and their potential irrational behaviour in making decisions based on market sentiment rather than in the best interests of the  client.

Which is better? Having the ‘Best Offence’ or the ‘Best Defence’?

28/2/2014

 
By John Eakins
This blog has had a number of contributions on factors which could be used to predict the English premier league winners (see here, here and here). Here is another one. Which will give you the greatest chance of winning the premier league – having the best offence (in terms of the greatest number of goals scored) or having the best defence (in terms of the lowest number of goals conceded)? It’s a topical question at the moment given that the current top 4 in
the premier league have two teams with the best offensive records in the league (Manchester City and Liverpool) and one team with the best defensive record in the league (Chelsea although one could arguably also add Arsenal, the other top 4 team, to this category if you exclude their big defeats to Manchester City and Liverpool). So who will triumph in the end?

Let’s look at long term trends first. Table 1 provides summary statistics based on data for the past 50 seasons of the English league. The table also gives similar statistics for the German, Spanish and Italian leagues for comparison purposes. In the table there is information on the proportion of times the best offensive team has won the league, the proportion of times the best defensive team has won the league, the median final position of the best offensive and defensive team (as there is on occasion some extreme outlier’s in the final position of the best offensive and defensive team) and the associated standard deviation.
Picture
The figures suggest that a greater proportion of English winners have been the best offensive team although the difference between this figure and the proportion of winners with the best defensive record is small. The median position of the best offensive team is also higher relative to the best defensive team. In Germany, we have the opposite trend with the best defensive team winning a significantly greater proportion of titles and having a higher  median position. In Spain, offensive teams are more successful, while in Italy, defensive teams are slightly more successful. So in ranking from most offensive to least offensive we have Spain, England, Italy and Germany. It is interesting that this ranking would bear our preconceived notions regarding football in these countries.
 
Table 2 presents the same data but this time for just the past 20 seasons of each league. In the English and German leagues there is a clear move toward more offensive teams winning the league title and having a higher median  position in the league. In the Spanish league offensive teams are just as successful while defensive teams are becoming less successful with a relatively lower median position in the league. Finally, Italy appears to buck the trend
with defensive teams becoming relatively more successful over the last 20 seasons relative to the last 50 seasons.  It would be interesting to see how this correlates with success at European and International level but that is left to another day. 
Picture
Back to our initial question. There does appear to be clear trend toward more offensive teams winning the English premier league (and other leagues) so that would favour Manchester City and Liverpool. Defensive strength is still clearly important and out of these two Manchester City have the best defensive record. So a tentative nod to Manchester City to win the premier league 2013/14. In Germany, Bayern Munich are clear favourites having the best  offensive and defensive records so far. In Spain, the analysis suggests that it’s a shoot-out between Barcelona and Real Madrid (not so much of a surprise there), while in Italy Roma could be an outside bet given that they currently has the  best defensive record.

Goal Kicking Performance in International Rugby Union Matches

19/2/2014

 
By John Eakins
This just goes to show why New Zealand are the best rugby team in the world – their attention to detail. Ken Quarrie who works as an analyst for New Zealand rugby has carried out research on the goal kicking performance of international rugby players using data from 582 international rugby matches played between 2002 to 2011. The research is about to be published in the Journal of Science and Medicine in Sport (February 2014 see here).
Picture
I first noticed this on the score.ie and you can read what they think of the research (here). They also provide a link to the rankings spreadsheet on the All Blacks’ official website but for convenience it can be found (here).  Quarrie first ranks goal kickers based on their percentage success rate (a raw rank) and then adjusts this ranking (modelled rank) for factors that include kick distance, kick angle, a rating of the importance of each kick and venue-related conditions.  Based on this modelled rank the top three goal kickers over the period 2001 to 2011 are Morne Steyn (South Africa), Federico Todeschini (Argentina) and Dan Carter (New Zealand). From an Irish point of view, David Humphreys is the top ranked Irish goal kicker (15th) followed by Ronan O’Gara (34th), Paddy Wallace (39th) and Jonny Sexton (90th). O’Gara was the second best ranked goal kicker in 2010 and 2011. What is interesting is that apart from Morne Steyn (who it appears stands head and shoulders above everybody else with an adjusted success rate of 87%), there is not too much difference in the goal kicking performance of say the top 50 players. Todeschini has an adjusted success rate of 80% while Gavin Williams (Samoa) in 50th place has an adjusted success rate of 73%. So as expected not much separates the top goal kickers at international level.

Quarrie also provides what he calls an importance ranking which ranks the goals kickers solely on the success rate for kicks under pressure. He defines an important kick as one that is likely to reflect affect the outcome of the match. Specifically, the score difference at the time of the kick and the time remaining in the match are used to measure the overall kick importance. Based on this ranking the top three goal kickers are James O Connor (Australia), Morne Steyn (South Africa) and Stirling Mortlock (Australia). Ronan O’Gara (39th) is now the most highly ranked Irish player followed by Jonny Sexton (42nd), then Paddy Wallace (51st) and finally David Humphreys (86th). A lot of reports picked up on this ranking but again it is important to note that the difference in the success rates on these kicks under pressure across all the kickers in the sample is not great. So while David Humphreys is ranked 86th, his actual success rate on pressure kicks is 71% compared to James O Connor at 76%. 

One final interesting titbit from the research is the fact that over the matches studied, goal kicks comprised 45% of the total points scored, with penalties accounting for 29% and conversions 15%. This can be compared to 53% of scores that come from tries, and 2% that come from drop goals. This in itself highlights the important of the goal kicker in modern day international rugby.

<<Previous

    Archives

    May 2023
    April 2023
    March 2023
    February 2023
    January 2023
    December 2022
    November 2022
    October 2022
    September 2022
    August 2022
    July 2022
    June 2022
    May 2022
    April 2022
    March 2022
    February 2022
    January 2022
    December 2021
    November 2021
    October 2021
    September 2021
    August 2021
    July 2021
    June 2021
    May 2021
    April 2021
    March 2021
    February 2021
    January 2021
    December 2020
    November 2020
    October 2020
    September 2020
    August 2020
    July 2020
    June 2020
    May 2020
    April 2020
    March 2020
    February 2020
    January 2020
    December 2019
    November 2019
    October 2019
    September 2019
    August 2019
    June 2019
    May 2019
    April 2019
    March 2019
    February 2019
    January 2019
    December 2018
    November 2018
    October 2018
    September 2018
    August 2018
    July 2018
    June 2018
    May 2018
    April 2018
    March 2018
    February 2018
    January 2018
    December 2017
    November 2017
    October 2017
    September 2017
    August 2017
    July 2017
    June 2017
    May 2017
    April 2017
    March 2017
    February 2017
    January 2017
    December 2016
    November 2016
    October 2016
    September 2016
    August 2016
    July 2016
    June 2016
    May 2016
    April 2016
    March 2016
    February 2016
    January 2016
    December 2015
    November 2015
    October 2015
    September 2015
    August 2015
    July 2015
    June 2015
    May 2015
    April 2015
    March 2015
    February 2015
    January 2015
    December 2014
    November 2014
    October 2014
    September 2014
    August 2014
    July 2014
    June 2014
    May 2014
    April 2014
    March 2014
    February 2014
    January 2014
    December 2013
    November 2013
    October 2013
    September 2013
    August 2013
    July 2013

    About

    This website was founded in July 2013.

    RSS Feed

    Categories

    All
    American Football
    Athletics
    Baseball
    Basketball
    Behavioural Economics
    Boxing
    Broadcasting
    Competitive Balance
    Cricket
    Cycling
    Darts
    David Butler
    Declan Jordan
    Drugs
    Ed Valentine
    Epl
    Esports
    Expenditure
    F1
    Fifa World Cup
    Finances
    Funding
    Gaa
    Gaelic Games
    Gambling
    Game Theory
    Gary Burns
    Geography
    Golf
    Greyhound Racing
    Guest Posts
    Horse Racing
    Impact Studies
    John Considine
    John Eakins
    League Of Ireland
    Location
    Media
    Mls
    Mma
    Olympics
    Participation
    Paul O'Sullivan
    Premier League
    Regulation
    Research
    Robbie Butler
    Rugby
    Simpsonomics
    Snooker
    Soccer
    Spatial Analysis
    Sporting Bodies
    Stephen Brosnan
    Swimming
    Taxation
    Teaching
    Technology
    Tennis
    Transfers
    Uefa
    Ufc
    World Cup
    Wwe

Related

The website is not formally affiliated to any institution and all of the entries represent the personal views and opinions of an individual contributor. The website operates on a not-for-profit basis. For this reason we decline all advertisement opportunities. 

Contact

To contact us email sportseconomics2013@gmail.com or find us on Twitter @SportEcon.