|
By John Considine Here is a podcast on the reasons for sports subsidies and the impact of sports subsidies. Professor Lawrence White (George Mason University) interviews Brad Humphreys and Dennis Coates about their research. At times the discussion can be a little technical and it might be best suited for those with some background in economics. However, sports economists will enjoy the discussion. Both of these economists contribute to the blog thesportseconomist.com.
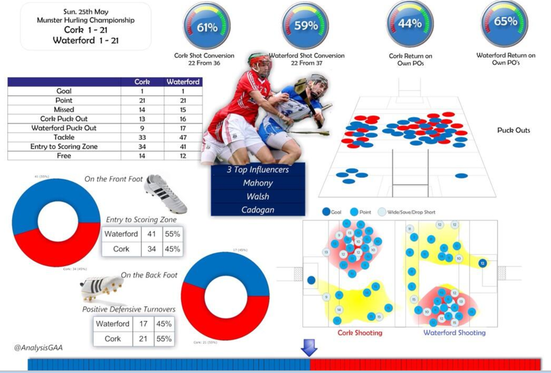
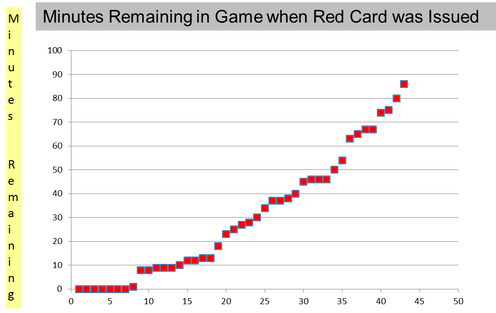
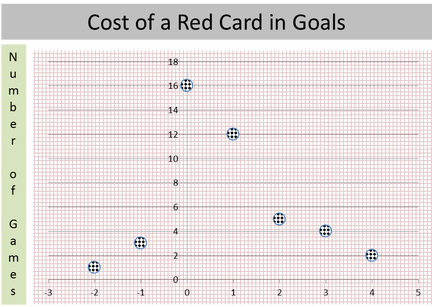
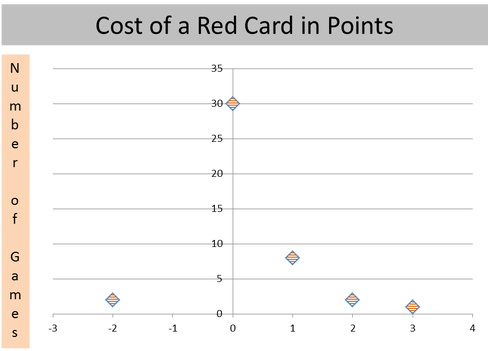
By John Considine Earlier this week, as I was grading summer examination papers, Seamus Coffey sent me the following statistical output on the Cork - Waterford, Munster Senior Hurling Championship game. The output was produced by Ray Boyne (here). It is an example of what inter-county teams use to examine their performance (Ray was involved with the Dublin senior footballers for a number of years). Of course, the statistical and video analysis that is conducted by teams goes much deeper than what is presented below. Last January, I attended a presentation organised by Avenir Sports on the type of work they do with inter-county teams. In the presentation, Sean O'Donnell outlined the extensive work done analysing the playing and training performances of the Cork senior hurling team. I was left pondering the gap between the statistical analysis on academic performance and those of sporting performance. While academic assessment practices are improving, they could benefit from a look at the sporting world. At a minimum GAA teams would have the above type of material to them before their next training session (usually two days later). Timely and detailed feedback is followed by planned performance improvement. A pretty good system. Unfortunately, a portion of academic assessment falls short of timely and detailed feedback. Sometime this is a function of student numbers and the lack of technological supports. However, there are some technological developments helping to facilitate academic performance improvement. For example, in economics there are systems like MyEconLab and Aplia. The latter was developed by Paul Romer. Romer's thinking about the crossover between performance assessment in sport, and that in the study of economics, is discussed by David Warsh in his book Knowledge and The Wealth of Nations. Romer believes that students need a coach, and that as a coach what he "needed was the equivalent of a stopwatch, or a heart-rate monitor - some way of gauging their performance and discovering which areas needed work". As a result, Romer developed an online assessment system for students of economics that allows them to assess their knowledge and receive immediate feedback. Aplia is limited in its application and is far from providing a silver bullet for students of economics (see an evaluation of its potential here is a piece by Brendan Kennelly, Darragh Flannery and myself). However, Aplia and MyEconLab do provide another support mechanism in evaluating student performance and providing timely feedback.  The above sporting statistics and assessment systems are only scratching the surface when compared to the way such data is used in other settings. An example of how F1 use an almost unimaginable amount of performances statistics is explained in a TED talk by Peter van Manen (here). The skills involved have been put to good use outside of F1. Van Manen explains how they used their expertise in data analysis to help monitor the health of babies in life and death situations. As time passes, we can expect the the use of sporting statistics to increase. However, they are unlikely to prove a short-cut to success on the field. They can be a useful supplement to hard work rather than a substitute for it. In my experience, individuals who seek out new methods as a means of reducing their effort come unstuck. It is those that use new method to improve their performance that accumulate the benefits. I hope that not too much time will pass before we can see further improvements in the assessment systems in academia. By John Considine  There is a superb article by Philip Connolly in the recent edition of The Sunday Business Post titled 'By Jorge! Ronaldo's Agent and his Dublin connection'. Connolly explains that the attraction of Dublin for Jorge Mendes is "the same for many other body corporates - tax". I particularly like the sentences "At the head of a vast multimillion-euro business, the Portuguese agent sits atop an organisation that spans from Porto to the tax haven of the British Virgin Islands. In the middle is Ulysses House, a nondescript office block just north of Dublin's River Liffey. It is here that a subsidary of Gestifute, Mendes's agency, shares a registered office with more than 150 other companies." Connolly describes the British Virgin Islands as a tax haven and in the following sentences he discusses the 150 registered offices in Ulysses House. Imagine all the economic activity that takes place in Ulysses House! The article is not just about taxation. Connolly also discusses 'economic rights participation agreements' and the role of an entity called Quality Football. Most of us might associate Carlos Tevez with third-party ownership of a player's sporting rights. Connolly says explains how Norwich's Ricky van Wolfswinkle is another player with a connection to such agreements. Tevez kept West Ham in the Premier League while embroiled in controversy over his arrangements. Van Wolfswinkle was relegated with Norwich after a season where he contributed almost nothing on the scoreboard. By Ed Valentine and John Considine On Thursday we posted a piece on the cost of red cards. At first glance it seemed the cost of a red card was pretty high. In games with one red card, two-thirds of the teams that received the card lost the game. They also conceded between twice and three times as many goals. These features of the games with red cards probably painted a slightly biased picture because no account was taken of the state of play when the card was issued. In this post we will examine some of these issues. There were 43 games where a single red card was issued. At 90 minutes per game there would have been 3,870 minutes played in these games. However, only 1,305 minutes involved 10 players versus 11 players. The distribution of red cards by the number of minutes left in each game is presented in the chart below. We will keep the analysis relatively simple by examining changes between the time the card was awarded and the final whistle. Imagine a suituation where the score of a game was 1-1 when a red card was issued to the away team. If the final score was 2-1 then we estimate the cost to the team in terms of goals as 1. We focus on the net cost in terms of goals. For example, if the score was 1-1 at the time of the card and it ended up 5-4 then the cost would also be 1. The chart below shows the cost to the team receiving the red card in terms of goals. The negative figure represent situations where the team that received the card scored more goals than their opponents. The -2 in the chart is for the game where Manchester City had their captain sent off against Hull when the score was 0-0. Despite this setback Manchester won the game by two goals. The above chart suggests that a red card will cost a goal every 35 minutes or so. The first chart above shows that more than half of the red cards come with less than 35 minutes. This suggests that the cost of a red card might not be a large as we suggested in our earlier post. What happens when we examine the cost of the red card in terms of points. As in the case of goals, we calculate the cost of the red card by examining the change in scoreline between the time of the card and the final whistle. Where a team was drawing the game 1-1 when the card was issued but lose the game 2-1 then the cost is the 1 point the team would have got from earning a draw. The chart below shows that the 43 red cards cost their teams 11 points in total. It means that a red card costs a team about a quarter of one point. That does not seem a huge amount. Two teams overcame a red card to turn a draw into a win. Eight teams went from drawing a game to losing it (and the point they would have earned). Two teams drew a game they were winning. Only one team (West Ham) lost a game they were winning after receiving a red card. Our post last Thursday showed that teams that are issued red cards do not perform well in those games. This post delved a little deeper and showed that the cost of the red card might not be a big as implied by our first post. It seems that many red cards are issued late in the games and have only a small impact on the result. The average cost in terms of points is 0.25 per game and on average a goal every 35 minutes 10 men are playing against 11. (The data is courtsey of Opta.)
By John Considine This time twenty years ago I was in York, England undertaking a Ph.D. in economics. During the year I tutored quantitative methods in a course delivered by Bill Gerrard. At the time I would have described Bill as a friendly, tall, long-haired Scot with an interest in Celtic, Leeds United and John Maynard Keynes. Today I would describe Bill as the "stats guy" with Saracens rugby football club - a club that this weekend will contest the Heineken Cup final - who has written widely on the economics of football.  Over the intervening two decades I have occasionally pestered Bill for advice on academic matters, sporting statistics matters, and a combination of the two. For example, when I was looking for a reading list on sports economics I banged off an email to Bill. The emails were always returned promptly and they were packed with helpful comments. Ten years ago Bill visited Cork to give a seminar. During his visit he explained how he discovered Moneyball. He also provided an entertaining account of what seemed like excessive payments for some players in the Premier League!!! Plenty has been written elsewhere about Bill's role in the Saracens project and his work on performance analysis (see here, here and here). Today he will be watching to see if that work has come to fruition at a European level. The following week they could also become champions of England. It would crown an already successful season for the club. I for one will be wishing Saracens and Bill are successful. By John Considine 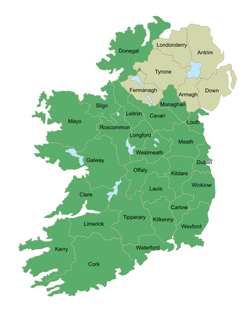 In 2008 I published a paper with a number of colleagues in Economic Affairs. The paper was titled 'Irish National Lottery Sports Capital Grant Allocations 1999-2007: Natural Experiments on Political Influence'. The paper examined what happened to the geographical distribution of sports capital grants when there was ministerial change. The two ministerial changes examine were (i) a change in the Minister for Sport and (ii) a change in the Minister for Finance. The paper claimed there was evidence of political bias in the funding. Jane Suiter and Eoin O'Malley used a more sophisticated statistical approach on the 2002-2007 grants and found similar results (see previous blog post here). This post outlines the evidence from our Economic Affairs paper and adds another natural experiment with 2012 data. Sport grant applications for National Lottery funding are sorted and assessed by county. There are 26 counties in the Republic of Ireland. The counties can be seen in the map opposite. Those in the Republic of Ireland are in dark green. At the time of our 2008 publication the counties of interest were Donegal and Kerry in respect of the Minister for Sport and Kildare and Offaly for the Ministers for Finance. Donegal and Kerry are located on the western side of the country whereas Kildare and Offaly are located in the midland/east of the country. Table 1 shows what happened when there was a change in the Minister for Sport. While the Minister for Sport came from Donegal, that county had the highest per person ranking of the 26 counties. When he was replaced by a Minister from Kerry then Kerry jumped to the number 1 spot and Donegal slipped to 23rd out of the 26 counties. Our second "natural experiment" looked at what happened when the Minister for Finance changed. Our results in Table 2 below show that while the Minister was from Kildare then Kildare received the second highest per person allocation of sports capital grants. When this minister left office, Kildare dropped to 26th (or last). The Minister for Finance for the 2005-7 grant allocations was from Offaly. This county had previously been 20th in the ranking. It jumped to 4th while its native son was in Finance. As economists these results seemed to suggest to us that the behaviour of politicians might be rational and self-interested. There was no moral outrage in the paper. It seemed to us that the incentives were such that the outcome was fairly predictable. The National Lottery was started in 1986. It was only in its infancy when politicians complained about the use of National Lottery funds. In 1988 Mary Harney (Progressive Democrats) claimed that "Fianna Fail have engaged in the most despicable exercise in gombeen politics ever seen in this country in the way they have handled the allocations from the national lottery" (here). A couple of year later the Progressive Democrats were in government with Fianna Fail. Now it was the turn of Alan Shatter (Fine Gael) to remind Mary Harney and her Progressive Democrat colleagues of her previous words (here). He finished with a flourish saying "The horse of political patronage will once again be ridden and the Minister, Deputy Flynn, like the Lone Ranger of old, will gallop off into the sunset with his faithful Tonto, Deputy Harney, the Minister of State, galloping along beside him". It would seem that Fianna Fail was the force corrupting all who came in contact with them. Tables 1 and 2 above might support that view as all four Ministers were from that political stable. In 2012 Alan Shatter's political party was the largest party in a coalition government between Fine Gael and Labour. Alan Shatter himself was Minister for Justice. Sport was being catered for by the Department of Transport, Tourism and Sport. One of the junior ministers in the Department was responsible for allocating the sports capital grants. The Minister come from Mayo. This gives us our third natural experiment. It is presented in Table 3. The data is that produced by the Department during 2012. Galway and Mayo are listed as having received €132 for the 1998-2011 period so Mayo is 15th or 16th (joint 15th). Maybe in future rounds, a rule limiting the dispersion of per person county allocations will be formalised. It should apply to ALL sports capital grants and not some or most of them. It should not be the case that it will apply to 85% of the grants. It should apply to 100%. The omens are promising. Last Sunday, speaking on RTE's The Week in Politics, the Minister for Transport, Tourism and Sport, Leo Varadkar, said "... also we need cultural change. You know too much in Ireland, and its not just a Garda issue, we still have a culture of doing favours, the nod and the wink, use of discretion, those type of things. And we need now, over the next ten or twenty years, to move to a rules based society so that this kind of stuff doesn't happen anymore. And it is not just about the Gardai it is about politics in general ..". Let's not wait for 10 or 20 years. The Minister would set a good example by starting in his own department and ensuring that there is limited Ministerial discretion on the allocation of ALL sports capital grants.
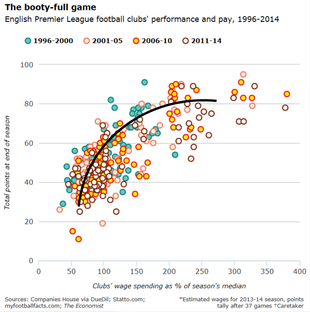
By John Considine This post is the latest in our week-long look at some sports economics in The Simpsons. The posts are to mark the publication by Stanford University Press of Homer Economicus: The Simpsons and Economics. In this post I'm going to look at some of the sports economics issues raised in Homer at Bat. Not surprisingly, this brilliant episode has been named as the best sports episode by Bleacher Report. It revolves around the idea of buying success in sport. In a striking similarity to Robert Redford in The Natural, Homer makes himself a bat and helps lead the Springfield Nuclear Power Plant softball team to an undefeated season. In the championship game they face Shelbyville Power Plant owned by Aristotle Amadopoulous. Monty Burns bets Amadopoulous $1m that Springfield will be successful in their contest. In an effort to increase his chances of winning, Burns hires a collection of Major League Baseball players and gives them jobs in the power plant. Due to bad luck, and some strange behaviour on the part of Monty Burns, all but one of the MLB ringers are unable to take their place in the game. The one exception is Darryl Strawberry - the player taking Homer's position. With the score tied and bases loaded with two outs in the bottom of the ninth inning, Burns replaces Strawberry with Simpson. Burns proceeds to confuse Homer with his signals. The confused Homer is hit on the head with the pitch bringing about the winning run. At the moment, from a European perspective, it is hard to recall the episode and not think about the UEFA Financial Fair Play rules. These rules arose, at least in part, to stop wealthy owners from investing large sums of money buying up players and potentially destablising the game. This week the media was awash with speculation that Manchester City and Paris Saint Germain were facing server penalties for breaching the rules (here). However, what I want to focus here is the issue of buying success or the cost of buying success. 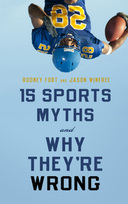 The issue of buying success forms one of the best chapters in an excellent book by Rodney Fort and Jason Winfree. The book is 15 Sports Myths and Why They're Wrong and, like Homer Economicus, it is published by the good people at Stanford University Press. The relevant chapter is called 'Owners and General Managers are Inept'. Fort & Winfree do a good job dispelling the myth captured by the chapter title (and seemingly personified by Mr Burns). Along the way a few people come in for some mild/harsh criticism. Sportswriter and broadcasters do not come out of the chapter that well. According to the authors, sportswriters and broadcasters implicitly accept and sell the idea that there are constant costs to winning. Fort & Winfree explain how the costs are non-linear and how they do not start at zero. A similar analysis is presented in a superb piece in the latest The Economist. - it can be accessed through their blog on sport called Game Theory. The graph below is reproduced from the article (although I have imposed the solid black production function that is available in some versions). One could apply the following few lines from Fort & Winfree, "Depending on the sport, it is usually easy to win a few games. However, wins get harder and harder to come by for good teams". The Economist finds that money matters. It also finds that the manager matters but not as much as money. Fort & Winfree do not concede that Owners and General Managers matter. In their efforts to prove that the decision makers are not inept, they leave the reader with the impression that Owners and General Managers do not matter much. As an example, they say that Billy Beane would be hard pressed to better the record of Brian Cashman (Yankees).
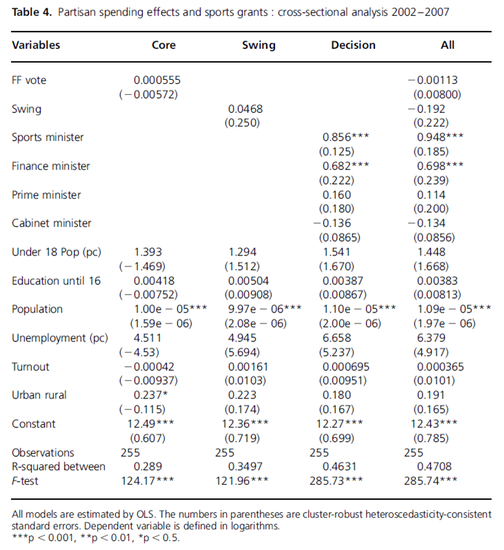
It would be fair to say that Fort & Winfree are not overly impressed by Michael Lewis and Moneyball. When discussing the cost of winning they say "We can't resist pointing out that the Oakland A's are also a bit below this more reasonable line (they were just above the earlier less reasonable solid line representation)." I'm guessing there is little between Billy Beane and Monty Burns. This brings us back to Darryl Strawberry. Burns brought Strawberry to the power plant to replace Homer in the softball team. This is the same Strawberry that features so prominently in Moneyball (the book rather than the movie). The book explains how the New York Mets had the first draft pick in 1980. They were considering Beane and Strawberry. It seems the Mets head coach wanted Beane but they selected Strawberry with their first pick because of influence from Sports Illustrated. They ended up getting both. Strawberry was their first pick and Beane was their second pick. It seems Sports Illustrated got it right - but for the wrong reason. Just like Burns got it right in replacing Strawberry with Simpson. By John Considine A Parliamentary Affairs article by Jane Suiter and Eoin O'Malley, available through the "advanced access", has some interesting findings about the allocation of sports grants in Ireland. Suiter & O'Malley examine various explanations of how government expenditure on sports and education is geographically allocated. They point out that the literature suggests that expenditure might be directed towards the government's core supporters, towards swing constitutencies, or it could be determined by the decision making rule. They test these alternatives using Irish data.
They note that in the Irish political system "the minister, has clear and predictable incentives for targeting spending". They also note that in The 2007 Irish Candidate Study "sports clubs and schools are the top two areas that legislators themselves believe it is worth claiming credit for". Given Ireland Proportional Representation - Single Transferable Vote system, one might expect the government expenditure to be related to the geographic location of the deciding minister(s). Suiter & O'Malley run three models to test if expenditure might be directed towards the government's core supporters, towards swing constitutencies, or if it is determined by the decision making rule. The results of their tests are presented in the table below (Table 4). The third model tests their suggestion that the decision rule is the most important. They say their "results are both positive and highly significant and the model shows that constitutencies of the decision-making ministers do significantly better than other constituencies". It seems the sports grants go to the constituency of the Minister for Sport and the Minister for Finance. By John Considine  To mark the publication of Homer Economicus: The Simpsons and Economics a few of the blog posts published this week will focus on sports economics in The Simpsons. As one of the people who contributed a chapter to Joshua Hall's book, I will kick things off with a look at the episode The Old Man and the "C" Student. Lisa writes to the International Olympic Committee and asks them to consider Springfield as a potential host city for the Olympic games. A bickering committee, lobbying for their own countries, cannot agree so the IOC chairman decides they should visit Springfield. Homer enters the competition to select the mascot for the games. His "Springy" mascot wins. However, Homer's hope of making money from his dangerous mascot are dashed after Bart's unsavoury antics in front of the IOC representatives (and despite Chief Wiggum's attempts to offer the IOC members women, drugs and money). Many will recognise the black humour in the words of newscaster Ken Brockman when he says that economists predict that Springfield will experience the same boom that Sarajevo enjoyed after the 1984 games. Sarajevo hosted the 1984 Winter Olympics (Los Angeles hosted the 1984 Summer games). Within a decade Sarajevo was a war zone. Jim Waterson at BuzzFeed provides 19 Haunting Pictures of the venue. It is only a cartoon character, like Ken Brockman, that would get away with making those comments about Sarajevo. However, it does illustrate a central point made by economists about the costs and benefits of such events. For example, previous posts on this site have highlighted the costs associated with 2014 Sochi Olympics (here) , the optimism bias and strategic claims by bidders (here), and the manner in which voters in other potential host cities are withdrawing from the bidding process. Last Saturday, Robbie Butler discussed the Brazil Olympics on a radio station in Montreal (a city that only recently fully paid for its 1976 Summer Games). The cost to cities seeking to host the games are outlined in Michael Leeds and Peter von Allmen's textbook The Economics of Sports. Leeds & von Allmen say it cost Los Angeles $1m for its unsuccessful 1924 bid and Cleveland $3m for its unsuccessful bid for the 1932 games. They say Montreal spent C$1.6 billion on the 1976 games. Leeds & von Allmen point out that those bidding are dealing with a monopolist that seeks to maximise its return for awarding the games to a city. They argue that it is the monopoly that the IOC have that allows it to extract resources from bidding cities. Homer's attempt to benefit from the games with his Olympic merchandise reflects the large amounts of money that are associated with Olympic merchandise. In his book The Economics of Staging the Olympics, Holger Preuss produced IOC figures revenues for such items. Preuss showed that the Organising Committee of the Olympic Games expected to get €151m from "pin" revenues in Athens 2004 (coins and stamps also generated significant revenues). Homer ended up literally flushing his investment down the toilet. His investment was derailed by events outside his control (even if he is Bart's dad). There are some similarities with McDonalds scratchcard promotion for the 1984 Los Angeles games when the USSR boycott cost them many meals (see here). Fans of The Simpsons will know that the series alluded to this in Lisa's First Word where Krusty Burger offers a similar promotion. More sports economics from The Simpsons to follow! By John Considine To a man with a hammer, everything looks like a nail. Therefore, it should not be surprising that I'm convinced that there is a growing interest in the economics of sport. And, I take new departures in that direction as (anecdotal) evidence that my hypothesis is correct. In recent month there has been two interesting developments in the financial press in these islands.
A couple of weeks ago, Matthew Engel started a weekly column in the Financial Times. His first column examined how the Hillsborough disaster coincided with a change in English football (here). Another column details Northampton's struggle to stay in the fourth tier of English football (here). It is worth reading for the way Engel ends the piece by putting sport in perspective. It is also worth reading for its identification of the perils of investing in a competition that involves relegation. Last Monday he discussed how China is waiting for a breakthrough in snooker (here) - I presume the Irish man he refers to is Ken Doherty rather than Alex Higgins or Dennis Taylor. Of course, there was plenty of sport in the Financial Times prior to Engel's columm. Superb sports related issues are likely to show up in what might seem like unlikely places. For example, the attempt by Massimo Cellino to takeover Leeds United was documented under "Travel & Leisure". Maybe it was the difficulties Mr Cellino encountered in his takeover attempt as a result of his failure to pay import duty on a yacht that brought the story under the heading of "Travel & Leisure". In Ireland, The Sunday Business Post launched a 'Business of Sport' page over a month ago. The decision was "in response to a range of reader surveys showing this to be an area of interest". In an effort to support my hypothesis on the growing interest in the area, I have emailed the newspaper for some data from the reader surveys. I hope to post on this issue if/when I get my hands on the data. The new page has a column by Ewan MacKenna and a feature on betting by Emmet Ryan. Its first outing on March 9th also had a story on Donald Trump's interest in Doonbeg Golf Club and a plan from the Minister for Transport, Tourism and Sport. Sport coverage is not limited to the 'Business of Sport' page in The Sunday Business Port. For example, two weeks ago Barry J. Whyte had an insightful piece on the distribution of salaries for American and Irish soccer players. Whyte says that while Robbie Keane earned $4.5m with LA Galaxy, 20 of the 31 players at the club are paid between $30,000 and $90,000. He also noted that "Keane's earning equate to the salaries of nearly 78 League of Ireland players". If my hypothesis is correct then expect a rise in the number of such columns and pages. |
Archives
June 2024
About
This website was founded in July 2013. Categories
All
|


 RSS Feed