By Ed Valentine and John Considine
On Thursday we posted a piece on the cost of red cards. At first glance it seemed the cost of a red card was pretty high. In games with one red card, two-thirds of the teams that received the card lost the game. They also conceded between twice and three times as many goals. These features of the games with red cards probably painted a slightly biased picture because no account was taken of the state of play when the card was issued. In this post we will examine some of these issues.
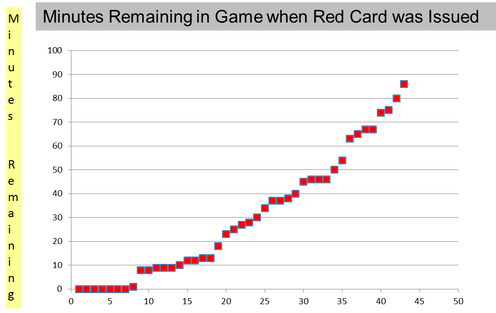
There were 43 games where a single red card was issued. At 90 minutes per game there would have been 3,870 minutes played in these games. However, only 1,305 minutes involved 10 players versus 11 players. The distribution of red cards by the number of minutes left in each game is presented in the chart below.
There were 43 games where a single red card was issued. At 90 minutes per game there would have been 3,870 minutes played in these games. However, only 1,305 minutes involved 10 players versus 11 players. The distribution of red cards by the number of minutes left in each game is presented in the chart below.
We will keep the analysis relatively simple by examining changes between the time the card was awarded and the final whistle. Imagine a suituation where the score of a game was 1-1 when a red card was issued to the away team. If the
final score was 2-1 then we estimate the cost to the team in terms of goals as 1. We focus on the net cost in terms of goals. For example, if the score was 1-1 at the time of the card and it ended up 5-4 then the cost would also be 1. The chart below shows the cost to the team receiving the red card in terms of goals. The negative figure represent situations where the team that received the card scored more goals than their opponents. The -2 in the chart is for the
game where Manchester City had their captain sent off against Hull when the score was 0-0. Despite this setback Manchester won the game by two goals.
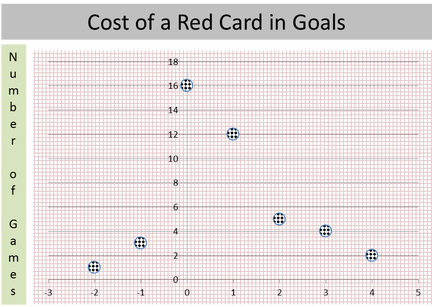
The above chart suggests that a red card will cost a goal every 35 minutes or so. The first chart above shows that more than half of the red cards come with less than 35 minutes. This suggests that the cost of a red card might not be a large as we suggested in our earlier post.
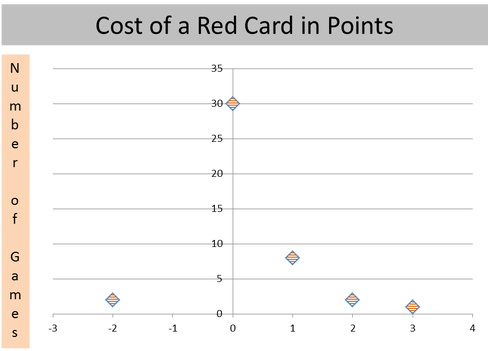
What happens when we examine the cost of the red card in terms of points. As in the case of goals, we calculate the cost of the red card by examining the change in scoreline between the time of the card and the final whistle. Where a team was drawing the game 1-1 when the card was issued but lose the game 2-1 then the cost is the 1 point the team would have got from earning a draw.
The chart below shows that the 43 red cards cost their teams 11 points in total. It means that a red card costs a team about a quarter of one point. That does not seem a huge amount. Two teams overcame a red card to turn a draw into a win. Eight teams went from drawing a game to losing it (and the point they would have earned). Two teams drew a game they were winning. Only one team (West Ham) lost a game they were winning after receiving a red card.
Our post last Thursday showed that teams that are issued red cards do not perform well in those games. This post delved a little deeper and showed that the cost of the red card might not be a big as implied by our first post. It seems that many red cards are issued late in the games and have only a small impact on the result. The average cost in terms of points is 0.25 per game and on average a goal every 35 minutes 10 men are playing against 11.
(The data is courtsey of Opta.)
 RSS Feed