By David Butler
As goals often don’t tell the full story of a football match, we’ve become acquainted with the xG stat. Expected goals are calculated based on the chance that a shot will be scored given the characteristics of that attempt (location of shot, body part used etc.).
There are various providers that calculate this statistic and lots of the underlying methods are private. There might be a concern however that different methods lead to different conclusions – a problem we don’t get when evaluating goals.
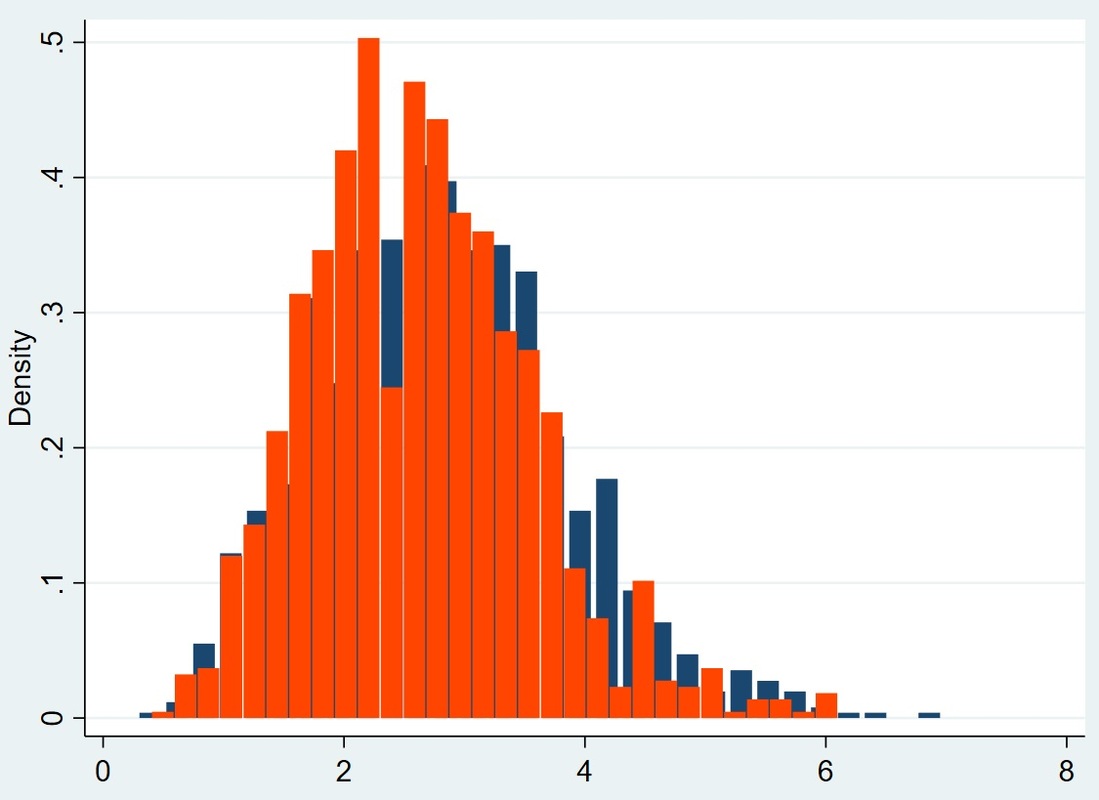
The histogram below displays the distributions of Xg (match) for recent seasons in the Premier League for two firms providing this statistic. From the data we learn that providers are using different models/techniques to derive Xg as both distributions do not plot directly onto one another. That said, the distributions are similar, so these minor variations may not be a cause for great concern.
As goals often don’t tell the full story of a football match, we’ve become acquainted with the xG stat. Expected goals are calculated based on the chance that a shot will be scored given the characteristics of that attempt (location of shot, body part used etc.).
There are various providers that calculate this statistic and lots of the underlying methods are private. There might be a concern however that different methods lead to different conclusions – a problem we don’t get when evaluating goals.
The histogram below displays the distributions of Xg (match) for recent seasons in the Premier League for two firms providing this statistic. From the data we learn that providers are using different models/techniques to derive Xg as both distributions do not plot directly onto one another. That said, the distributions are similar, so these minor variations may not be a cause for great concern.
 RSS Feed