By Ed Valentine
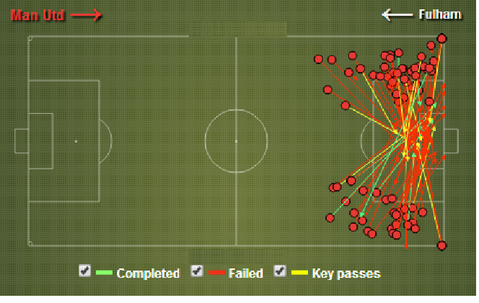
One of the most exciting games at Old Trafford this season was the 2-2 draw with Fulham last February. One stat that did the rounds, other than the result, was that Manchester United managed to amass a total of 81 crosses during the game. The performance statistics from the match analysis show that United were the better team in terms of chances, patterns of play and enjoyed 74% possession. But could the Red Devils have been more intelligent offensively?
Over the last five premier league seasons the winners of the title have averaged 2.34 goals per game while the team finishing in fourth has averaged 1.8. This would raise the argument that a team intending to win the league needs an attacking strategy that can yield more than two goals per game. Is spreading the ball out wide and delivering it into the box the best way to achieve this?
Based on data from the 2012/13 Premier League season, it took 80.11 crosses to yield a goal from open play. The 20 top flight sides averaged 21.4 crosses per game. This would therefore demonstrate that, in median terms, a team should expect to score from an open play cross every 3 – 4 Premier League Games. This is some way off 2.34 goals per game.
Under Sir Alex Ferguson in 2012/13 the reds averaged 22.3 open play crosses per game and scored 19 goals, which results in 44.6 crosses per goal. A team which prioritises crossing with this level of pay back would herald a goal return from a cross every 2 games.
Perhaps this is where a problem is occurring for Moyes given that in the last three Premier League seasons Manchester United averaged 27.1, 25.8 and 22.3 crosses per game while registering 6.2, 3.9 and 3.7 through-balls per game. The amount of crossing is up to 29.7 per game under the former Everton boss with through-balls down to 1.2 per game. This is due largely to their play pattern under Moyes as he is putting more attention to attacking down the flanks. About 30% of United’s attacking under Sir Alex in his final three seasons occurred down the centre of the park. Under Moyes, this figure has been lowered to 24%, which is currently the lowest percentage in the Premier League.
The current tactical approach has lowered the effectiveness of the Old Trafford players’ attacking ability and the new offensive strategy is something David Moyes should cross off his list.
The current tactical approach has lowered the effectiveness of the Old Trafford players’ attacking ability and the new offensive strategy is something David Moyes should cross off his list.
 RSS Feed