By John Considine
Looking at the Premier League table in early March 2018 I was a little surprised by the neat goal difference column. The top six teams had a positive goal difference and the remaining fourteen had a negative goal difference. When I pointed out this to some of the other contributors to this blog, there was little surprise. They expected a skewed distribution of teams based on goal difference. Further investigation revealed that their expectations were in line with the data.
I started by comparing the distribution of goal differences in other top European leagues. On the morning of March 17th, the Spanish, French, German and Dutch leagues all had more teams with negative goal difference than positive goal difference. The Italian league had an equal number of teams with a positive and negative goal difference. (I treated zero as neither positive nor negative.)
Next I looked at the lower tiers of English football. The second, third, and fourth tiers of English football all had more teams with negative goal difference than positive goal difference (as of the morning of March 17th).
Both of these comparisons were at a point in time. The next comparison involved looking at the distribution of teams (by goal difference) over time. The picture below shows the difference in the percentage of teams with positive and negative goal difference in the top tier of English football since the 1969-70 season. I used the percentage because the number of teams in the top tier has varied from 20 to 22.
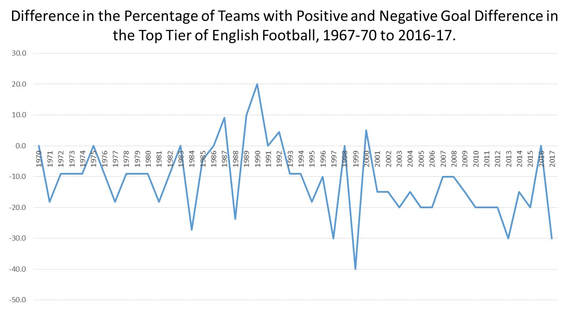
In only five of the seasons were there more teams with a positive goal difference than a negative goal difference. Four of these occurred between 1987 and 1992. This was a period where the league went from 22 teams to 21 teams and to 20 teams (before going back to 22 in 1992-93). It was within a decade of the introduction of three points for a win (compared to two points previously). There were other unusual features around this time period. For example, the 1992-93 season was the inaugural Premier League season and in that season Norwich City finished 3rd with a negative goal difference.
Regardless of whether we look across (i) top flight of European football in 2018, (ii) the top four tiers of English football in 2018, or (iii) the top tier of English football since 1969-70, there are more teams with a negative goal difference than a positive goal difference. This leaves me with the question: Why?
Regardless of whether we look across (i) top flight of European football in 2018, (ii) the top four tiers of English football in 2018, or (iii) the top tier of English football since 1969-70, there are more teams with a negative goal difference than a positive goal difference. This leaves me with the question: Why?
 RSS Feed