By Ed Valentine and John Considine
During the 2013-14 Premier League season there was a total of 53 red cards issued. There were 43 games with one red card and 5 games with two reds. The away team got 70% of these cards. There were six player who got more than one red card. Wes Brown got 3 (at least one was pretty harsh). Two reds were dished out to Kevin Nolan, Chico Flores, Younes Kaboul, Allan MacGregor, and Nemanja Vidic. This is the first of two posts that examines how much these cards might have cost their teams.
The graph below shows no clear relationship between league position and red card count, e.g. top 5 got 10 whereas bottom 5 got only 8 cards. Brown's three red cards helps Sunderland to the top of the list. Newcastle with one fewer cards has the highest number of different players with red cards (6).
The graph below shows no clear relationship between league position and red card count, e.g. top 5 got 10 whereas bottom 5 got only 8 cards. Brown's three red cards helps Sunderland to the top of the list. Newcastle with one fewer cards has the highest number of different players with red cards (6).
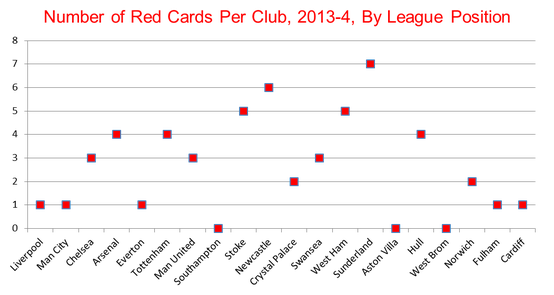
However, the above picture does not reveal the cost of getting a red card in terms of goals or points. We will start by examining games with only one red card. There were 5 games with two red cards. Chelsea, Newcastle, Stoke and Sunderland got doubles while Newcastle & Norwich shared two in their game at Carrow Road.
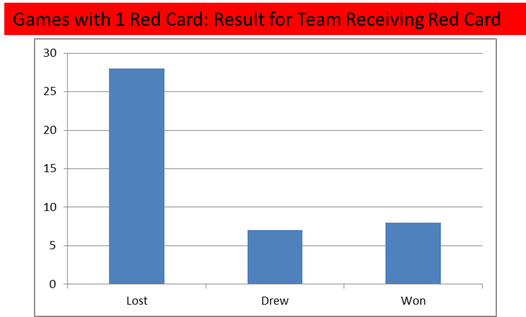
To keep things simple we will focus on games with single red cards. As a first aproximation to the cost of the single cards, we will look at the goals and win-lose-draw outcome of these games. It is a first approximation and, ideally, the analysis should be conducted only for that part of the game after the red card was issued - this will be the focus of our second post. Accepting this limitation, the bar chart below reveals that the team that gets the red card tends to lose that game. Two-thirds of these games end up with the team that got the red card losing. The other third is divided between winning and getting a draw.
To keep things simple we will focus on games with single red cards. As a first aproximation to the cost of the single cards, we will look at the goals and win-lose-draw outcome of these games. It is a first approximation and, ideally, the analysis should be conducted only for that part of the game after the red card was issued - this will be the focus of our second post. Accepting this limitation, the bar chart below reveals that the team that gets the red card tends to lose that game. Two-thirds of these games end up with the team that got the red card losing. The other third is divided between winning and getting a draw.
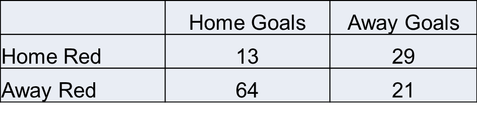
The away team received 72% of all red cards. In the games with just one red card then the percentage that goes to the away team drops to 65%. The table below shows that, when an away team got a single red card then, away teams scored only 21 goals whereas the home teams scored 64 goals. This is a 3-to-1 ratio. When the home team got a red card then the away team scored double the number of goals in those games (29 to 13). On these numbers it seems the cost of a red is relatively high in terms of goals.
This first glance at the cost of a red cards is a very rough approximation. No account is taken for the stage of the game at which the red card was issued. Our next post will delve a little deeper on the issue.
(The data is courtsey of Opta.)
(The data is courtsey of Opta.)
 RSS Feed