By John Eakins
The Irish Household Budget Survey (HBS) is a survey of a representative random sample of all private households in the State. It collects data on weekly household expenditures for a wide variety of commodities with the main purpose being to update the weighting basis of the Consumer Price Index. The most recent results of the HBS were released last year and were based on a survey of 5,891 households that took place in 2009/10. There are a number of expenditure items recorded in the HBS which can be considered sports related but in this blog post I will look at just two, admission charges for spectator sports and expenditures related to sports participation (excluding subscriptions).
The first thing to note is that not all households spend money on spectator sports and sports participation. For many households, sports related purchases do not comprise part of their normal basket of goods (and many households spend on sports related items, i.e. subscriptions to sports clubs, which are not considered here). Figures 1 and 2 show the percentage of households (as a proportion of the overall sample surveyed) with positive spectator expenditures and positive participation expenditures.
The first thing to note is that not all households spend money on spectator sports and sports participation. For many households, sports related purchases do not comprise part of their normal basket of goods (and many households spend on sports related items, i.e. subscriptions to sports clubs, which are not considered here). Figures 1 and 2 show the percentage of households (as a proportion of the overall sample surveyed) with positive spectator expenditures and positive participation expenditures.
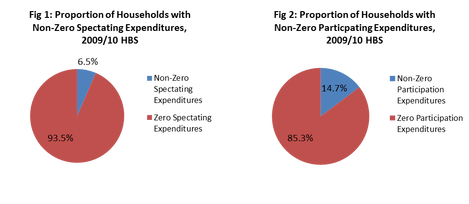
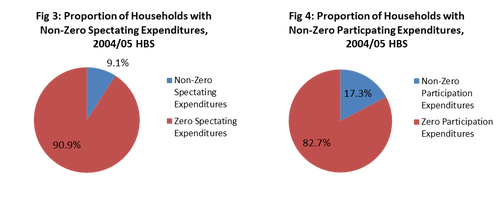
As can be seen, a greater number of households (in proportionate terms) spend money on sports participation compared to sports spectating. A comparison with the values from the previous HBS (taken in the years 2004/05) is shown in figures 3 and 4. In both cases the proportion of households with positive spectator and positive participation expenditures has fallen between the two surveys.
There are numerous reasons for this although the actual cost of the good should be one of the more
important factors. Figure 5 compares the average level of spend by Irish households on these two goods (based on using positive expenditure values only).
important factors. Figure 5 compares the average level of spend by Irish households on these two goods (based on using positive expenditure values only).
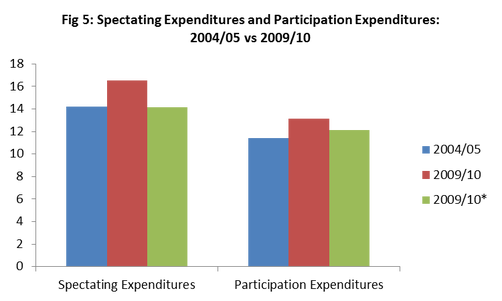
For both goods the average level of spend has increased between 2004/05 and 2009/10. However this statement needs to be qualified, as the increase in expenditures includes both a price increase and an increase in the quantity or volume spent (the ‘real’ change). The Central Statistics Office collects prices indices for the two sub-categories of sports expenditures, so one can deflate the 2009/10 values (i.e. remove the price effect) in order to provide a more appropriate comparison. Figure 5 also displays the deflated average 2009/10 values (indicated with an asterisk). These values indicate that the volume of spectating purchases has fallen marginally by -0.3% while the volume of participation purchases has increased sizeably by 6.5%.
The changes in the volume of sports expenditures have to be looked at in the context of changes in the overall levels of total household expenditure. Between 2004/05 and 2009/05, average total weekly household expenditures increased by 3% but with inflation running at approximately 7% during the period, the real change was in fact a decrease of 4%. Therefore it appears that the decrease in the volume of household consumption over the 2004/05 to 2009/10 period is hitting spectating expenditures harder relative to participation expenditures. Using economics jargon, we say that spectating expenditures are more income elastic relative to participation expenditures. Participation expenditures on the other hand are probably influenced to a greater extent by qualitative factors such as the age profile and family composition of the household. These variables may help to explain why proportionally fewer households are spending money on sports participation but the overall volume of spending is still increasing. For example we may have a relatively older population now compared to a number of years ago (so participation rates fall) but the younger age groups now are spending more (so spending on average increases). Further discussion of the
effect of these variables on sports purchases will be the subject of my next blog.
 RSS Feed