By David Butler
As a case study on my strategy module, I look at the ideas in Moneyball and consider ‘David vs. Goliath’ strategies. One factor I stress with students is that the outcomes as described in the book are very much the exception to the rule – this is what makes the story interesting. Also, I remind students that the Oakland A's didn't lift any trophies.
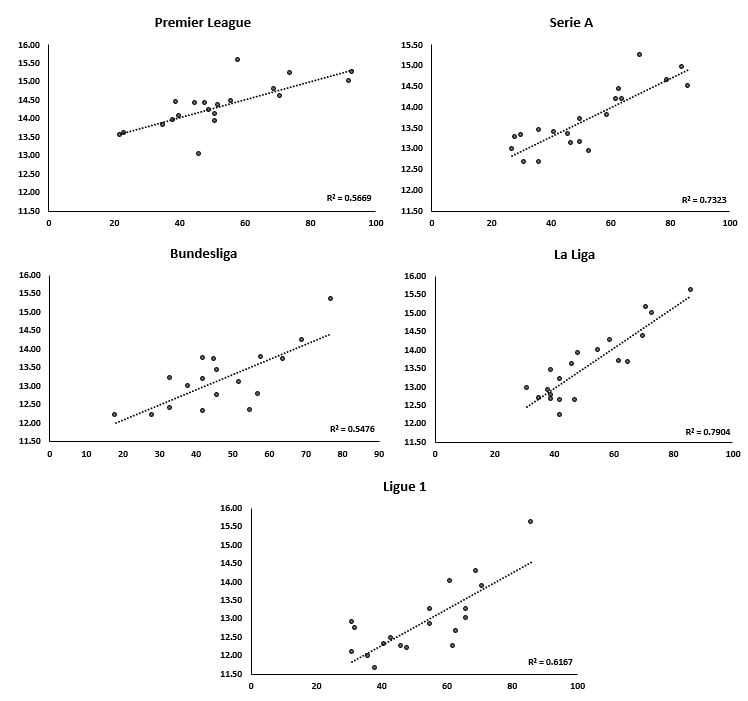
As the majority of football in Europe has finished for the 21/22 season, once again, we can see the regular relationship between salary spends and point accrued across the major leagues. The charts below plot the relationship between points totals and the log of annual net salary spend divided by squad size. This gives the an estimate of per-player spend (all in €). As can be seen in the charts, player salaries explain a lot of the variation in performance.
There are no vivid examples of successful Moneyball strategies, but some clubs did succeed - relatively speaking - with low budgets. Others are venturing toward the ‘moneyball-zone’ (bottom right-hand corner of the plots). Brentford bucked the trend in the EPL with a budget ~€11.75m (while Manchester United did the opposite). With an annual budget of ~€11m Verona finished 9th in Serie A. Freiburg finished 6th in the Bundesliga with one of the smallest budgets in the league - just under €6m. In France, Lens finished 7th with a budget of ~€5.2m.
The managers of these clubs did not win their leagues, but I often wonder whether this type of criteria should inform decisions on managerial awards.
As a case study on my strategy module, I look at the ideas in Moneyball and consider ‘David vs. Goliath’ strategies. One factor I stress with students is that the outcomes as described in the book are very much the exception to the rule – this is what makes the story interesting. Also, I remind students that the Oakland A's didn't lift any trophies.
As the majority of football in Europe has finished for the 21/22 season, once again, we can see the regular relationship between salary spends and point accrued across the major leagues. The charts below plot the relationship between points totals and the log of annual net salary spend divided by squad size. This gives the an estimate of per-player spend (all in €). As can be seen in the charts, player salaries explain a lot of the variation in performance.
There are no vivid examples of successful Moneyball strategies, but some clubs did succeed - relatively speaking - with low budgets. Others are venturing toward the ‘moneyball-zone’ (bottom right-hand corner of the plots). Brentford bucked the trend in the EPL with a budget ~€11.75m (while Manchester United did the opposite). With an annual budget of ~€11m Verona finished 9th in Serie A. Freiburg finished 6th in the Bundesliga with one of the smallest budgets in the league - just under €6m. In France, Lens finished 7th with a budget of ~€5.2m.
The managers of these clubs did not win their leagues, but I often wonder whether this type of criteria should inform decisions on managerial awards.
 RSS Feed