by Declan Jordan
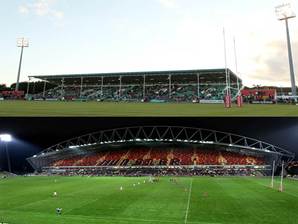
Munster Rugby is perhaps unique in professional sports by having two home grounds. The province's fixtures are split between Thomond Park in Limerick and Musgrave Park in Cork. Until this season the team also split its training being the two cities. Of course there is a lot of tradition associated with both venues and it would be difficult for rugby fans in either city to see the province become a one-city team.
Having two home venues creates logistical problems for Munster Rugby but it also raises the question of how they decide which games will go to each venue. The obvious difference between the venues is their respective capacities. Thomond Park can accommodate 26,000 fans while Musgrave Park is more modest, holding only just over 9,200. This difference explains why all Heineken Cup rugby matches are played at Thomond Park in Limerick (though the fortress mentality build up in various 'miracle matches' over the years also contributes).
However, in the RaboDirect Pro12 many of the matches are less of a draw than the Heineken Cup games. So, where the games may not be sell-outs perhaps the most important criterion for choosing a venue is whether Munster has a better chance of winning at one ground relative to the other. The aura of a fortress built up around Thomond Park because of the great victories there over many years and the 12 year unbeaten run in the Heineken Cup from 1995 to 2007. It is maybe worth looking though at the record in both grounds in the RaboDirect Pro12 (or Magners League and Celtic League as it was).
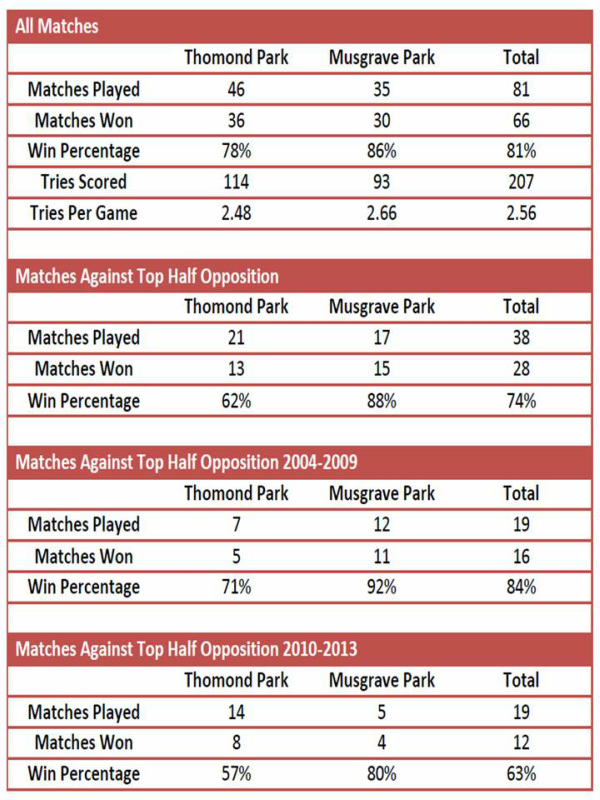
The table below shows the number of wins and win percentages and tries scored at each venue for all Celtic League, Magners League and Pro12 seasons from 2004 to 2013 (with the exception of the 2007/8 season when Thomond Park was under redevelopment and Munster Rugby were forced to play all of their home games at Musgrave Park).
The table shows most games over the period were played in Thomond Park (46 versus 35). However, it's also clear that Musgrave holds its own as a fortress with a win percentage of 86% relative to Thomond Park's 78% (it has to be said both of these figures are impressive). It also seems the nature of the wins were more entertaining in Musgrave - at least judging by the higher tries per game (these are just Munster tries).
It may be the case though that these figures hide a difference in the quality of the opposition, Better quality opponents may make games more attractive and so there may be a bias if Musgrave games are over-representative of games against poorer quality opponents.
The lower part of the table shows games against better opponents measured by their position in the league in the previous season. This shows games against teams that finished in the top half of the table in the season before (there are not exactly half as many games because Munster were always a top half team also). More top half teams came to Limerick than Cork (though this was reversed before the redevelopment of the Limerick stadium). This suggests that Munster Rugby do tend to bring the bigger games to Thomond Park to maximise potential attendances.
However, the relative win percentages do not change despite the quality of the opposition. Musgrave Park's win percentages are consistently higher than those in Thomond Park. This holds for the pre-development and post-development periods also.
This is a really hard finding for a proud Limerick man. But perhaps when Munster have a must-win game in the RaboDirect, by playing it in Cork they may improve their chances of winning at a cost of fans through the turnstiles. Perhaps the explanation for the success of Musgrave Park lies in the lack of attraction of the venue, which was reportedly described by former Munster prop forward Gary Halpin as being like the recreation area from the Shawshank Redemption.
Having two home venues creates logistical problems for Munster Rugby but it also raises the question of how they decide which games will go to each venue. The obvious difference between the venues is their respective capacities. Thomond Park can accommodate 26,000 fans while Musgrave Park is more modest, holding only just over 9,200. This difference explains why all Heineken Cup rugby matches are played at Thomond Park in Limerick (though the fortress mentality build up in various 'miracle matches' over the years also contributes).
However, in the RaboDirect Pro12 many of the matches are less of a draw than the Heineken Cup games. So, where the games may not be sell-outs perhaps the most important criterion for choosing a venue is whether Munster has a better chance of winning at one ground relative to the other. The aura of a fortress built up around Thomond Park because of the great victories there over many years and the 12 year unbeaten run in the Heineken Cup from 1995 to 2007. It is maybe worth looking though at the record in both grounds in the RaboDirect Pro12 (or Magners League and Celtic League as it was).
The table below shows the number of wins and win percentages and tries scored at each venue for all Celtic League, Magners League and Pro12 seasons from 2004 to 2013 (with the exception of the 2007/8 season when Thomond Park was under redevelopment and Munster Rugby were forced to play all of their home games at Musgrave Park).
The table shows most games over the period were played in Thomond Park (46 versus 35). However, it's also clear that Musgrave holds its own as a fortress with a win percentage of 86% relative to Thomond Park's 78% (it has to be said both of these figures are impressive). It also seems the nature of the wins were more entertaining in Musgrave - at least judging by the higher tries per game (these are just Munster tries).
It may be the case though that these figures hide a difference in the quality of the opposition, Better quality opponents may make games more attractive and so there may be a bias if Musgrave games are over-representative of games against poorer quality opponents.
The lower part of the table shows games against better opponents measured by their position in the league in the previous season. This shows games against teams that finished in the top half of the table in the season before (there are not exactly half as many games because Munster were always a top half team also). More top half teams came to Limerick than Cork (though this was reversed before the redevelopment of the Limerick stadium). This suggests that Munster Rugby do tend to bring the bigger games to Thomond Park to maximise potential attendances.
However, the relative win percentages do not change despite the quality of the opposition. Musgrave Park's win percentages are consistently higher than those in Thomond Park. This holds for the pre-development and post-development periods also.
This is a really hard finding for a proud Limerick man. But perhaps when Munster have a must-win game in the RaboDirect, by playing it in Cork they may improve their chances of winning at a cost of fans through the turnstiles. Perhaps the explanation for the success of Musgrave Park lies in the lack of attraction of the venue, which was reportedly described by former Munster prop forward Gary Halpin as being like the recreation area from the Shawshank Redemption.
The analysis is based on data compiled by Elliot Dineen a Third Year BSc Finance Student and author of a previous guest post.
 RSS Feed