by Declan Jordan

In a previous post I looked at the extent to which Premier League clubs have been increasing the rate at which they change managers. This is part of a research project for which I am controlling for the effect of managerial change on league performance. There have been several studies that have looked at the effect of managerial change on performance such as here and here (both by Audas, Dobson and Goddard). The former paper (Audas, Dobson and Goddard, 1997) found poor recent form drives many managerial terminations, while managerial turnover is more rapid in the lower divisions and that managerial change appears to have a harmful effect on team performance (measured by match results) immediately following a managerial termination. The latter paper (from 2002) finds that:
teams that changed their manager within-season are found to under-perform over the following 3 months. Managerial change also increases the variance of the non-systematic component of performance in the short term. The high incidence of within-season managerial change in English football may be a consequence of team owners gambling that an increased variance may help produce an improvement in performance sufficient to stave off the threat of relegation.
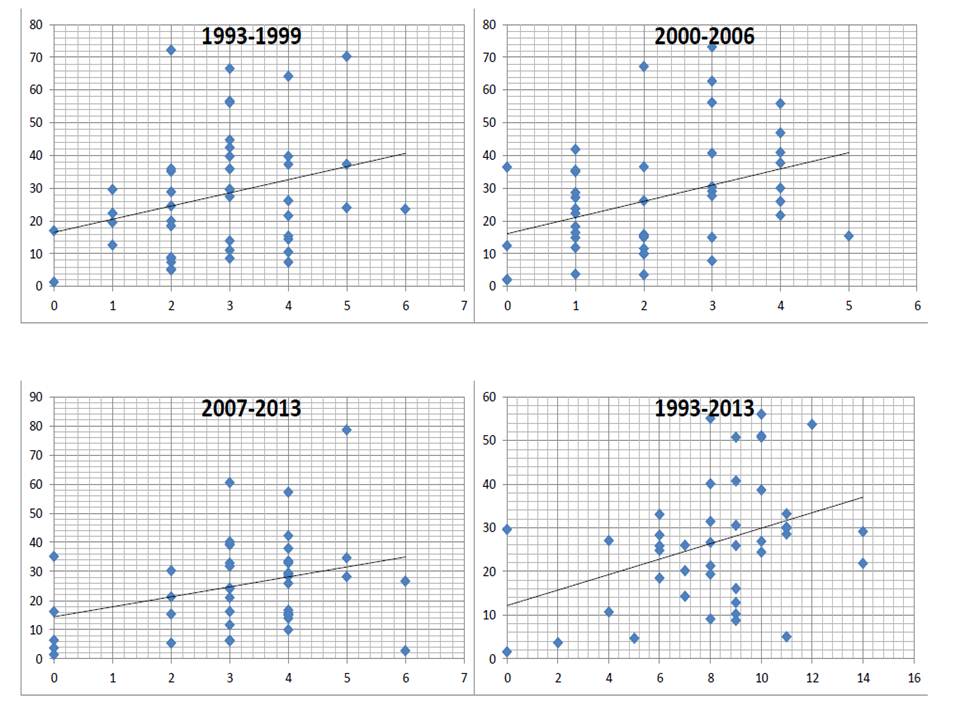
Using data from 1993 to 2013 (21 seasons) for all clubs that have appeared in the Premier League at least once, the grpahs below show the relationship between team performance (measured by the club's end of season position - from 1 to 92) and whether there was a managerial change in that season.
The data is broken into 3 equal periods of seven years. This means along the horizontal axis the number of seasons in the relevant period that a club changed manager (at least once). The vertical axis is the average league position for the number of seasons in the relevant period.
The graphs show a negative relationship between average league position and rate of managerial change over prolonged periods of time.
The data is collected as a control while testing other determinants of league performance. It is not possible here to address causation. Do poor-performing clubs change managers a lot or do clubs that change managers a lot under perform? There is little comfort here though for team owners gambling that an increased churn in manager provides sustainable improvement in performance.
 RSS Feed