By John Eakins
My first post on Irish Household Sports Expenditures (here) looked at spending on four categories of sport (spectator sports - admission charges, participant sports - excluding subscriptions, subscriptions to sports and social clubs and fees to leisure classes) in relation to changes between the 2009-10 and 2015-16 Household Budget Surveys (HBS) and in terms of variation in spending across location. In my second post, I am going to look at variation in spending on these items across gross income deciles.
According to the data recorded in the 2015-16 Household Budget Survey (HBS), the average gross weekly household income for the State was €1,099.70, which was 7.1% higher than the €1,026.77 figure recorded in 2009-10. Disposable income (which is arrived at after the deduction of income tax and social insurance) increased by 2.9% from €885.72 to €911.55. The table below displays average weekly disposable income by gross household income deciles for both surveys.
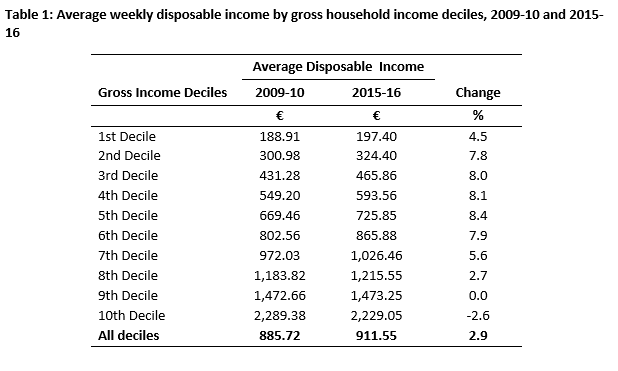
As can be seen deciles 1-8 all experienced an increase in average disposable incomes with larger increases especially for lower and middle earners. The 9th decile had practically no change while the 10th decile is the only one to experience a decrease. Bearing these values in mind, figures 1 to 4 show weekly expenditure data for the 4 categories of sports mentioned above by gross income decile.
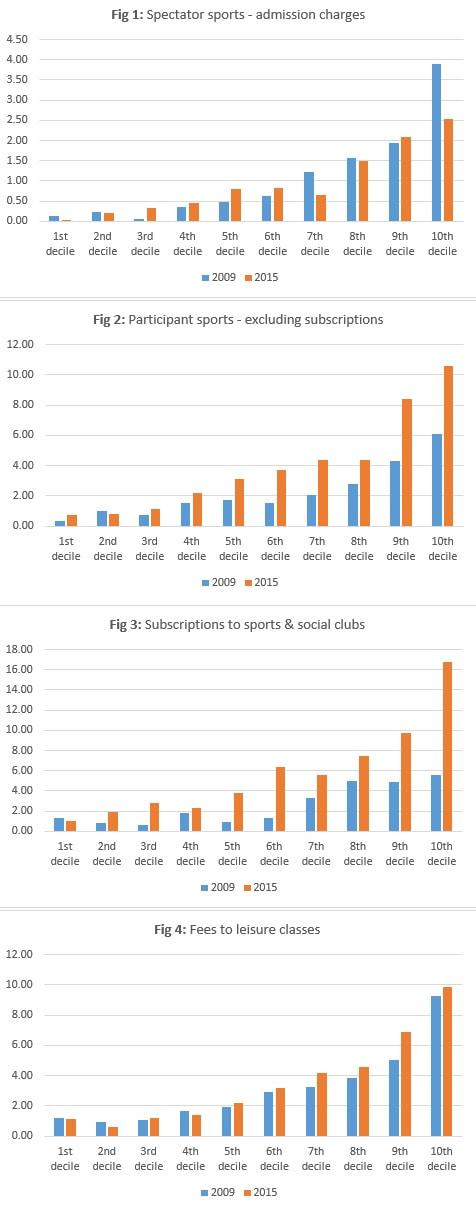
All of the goods are what economists would classify as normal goods, that is, as income increases, demand (or expenditure in this instance) also increases. Most goods are normal however, so what is perhaps more interesting is the response of expenditures to changes in income. One can look at this in two ways, either by looking at the variation in incomes across households at a point in time (i.e. looking at the variation across deciles for a particular HBS survey) or by looking at the variation in incomes for all households at two different points in time (i.e. looking at the variation in incomes across the two HBS surveys). In the case of the former, there appears to be ‘steady’ increases in sports spending up to about the 7th of 8th decile for each sports item. In the top two or three deciles spending increases more significantly. It could be the case that these households have a lot more disposable income left over after mortgages, childcare and other bills for sporting and leisure pursuits.
Income also has a positive influence across time for most sports categories. The patterns of spending on sports participation and subscriptions to sports clubs appear to have changed the greatest with a significant amount more been spent by middle and high earners. The latter is perhaps surprising given the changes in average disposable income for these earners shown in table 1. Fees to leisure classes, in the main, retain the same pattern across income deciles (with slight increases in each decile). In contrast to the other categories, spectator sports spending has fallen especially for high income earners although there are slight increases in spending for middle income earners. In my previous post I speculated that the overall drop in spending on spectator sports maybe a post-recession effect. The figures here suggest that this might be concentrated in households in the 10th decile where spending decreased significantly between 2009-10 and 2015-16. Perhaps these households have switched preferences from spectator sports to sports participation and/or sports clubs.
Overall, it is difficult to decipher what underlies these changes. The figures clearly show that there is an income effect but this is more pertinent for some categories of sport than others and is more pertinent for some income earners than others. There are clearly other effects too including sociodemographic variables. Next time, I will look at one of those which is closely related to income, livelihood status.
 RSS Feed