By John Eakins
Four years ago, myself and Robbie Butler wrote an article on Ireland’s chances of qualifying from our group in Euro 2012 (see here). We calculated all the possible final points outcomes of a four team group and then identified the points total which would guarantee or close to guarantee qualification i.e. 1st or 2nd place in the group. We reckoned that a win (3 points) was the minimum requirement and 4 points (a win and a draw) would put us in a reasonable position to qualify. 5 points would almost certainly seal the deal. Unfortunately it didn’t quite work out as we had hoped as Ireland lost all 3 games to finish bottom of the group.
Four years on and we have qualified once again for the Euros so it is opportune to revisit our previous work. What makes the analysis particularly interesting this time, is the fact that the competition has expanded to 24 teams, 6 groups of 4, and that four best placed 3rd place finishers also qualify for the knockout round of 16. So this should give us a better chance of getting out of our group relative to Euro 2012. But what does our statistical analysis reveal?
In total, there are 729 possible combinations of wins, draws and losses in a four team group (we do not adjust for quality difference between the 4 teams). If we take just one team in the group of 4 and tabulate the distribution of points arising out of these 729 combinations for this team (assuming 3 points for a win, 1 for a draw and 0 for a loss) we get the following:
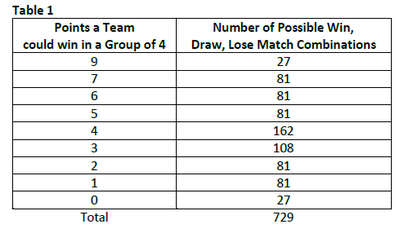
For example, a team in a group of 4 can end up with 9 points based on 27 different combinations of wins, draws and losses in the group games, 7 points based on 81 combinations, etc. The distribution is slightly asymmetric because of the higher points weighting given to wins.
Next we tabulate the position of a team with a certain points total (table 2). As previously stated a team can end up with 9 points from 27 different combinations of wins, draws and losses. But in all of these cases they will be in 1st position in the group. In short, having 9 points always wins the group. Similarly a team who attains 7 points will end up in 1st position in the group 72 out of a possible 81 times and tied 1st 9 out of 81 times.
Next we tabulate the position of a team with a certain points total (table 2). As previously stated a team can end up with 9 points from 27 different combinations of wins, draws and losses. But in all of these cases they will be in 1st position in the group. In short, having 9 points always wins the group. Similarly a team who attains 7 points will end up in 1st position in the group 72 out of a possible 81 times and tied 1st 9 out of 81 times.
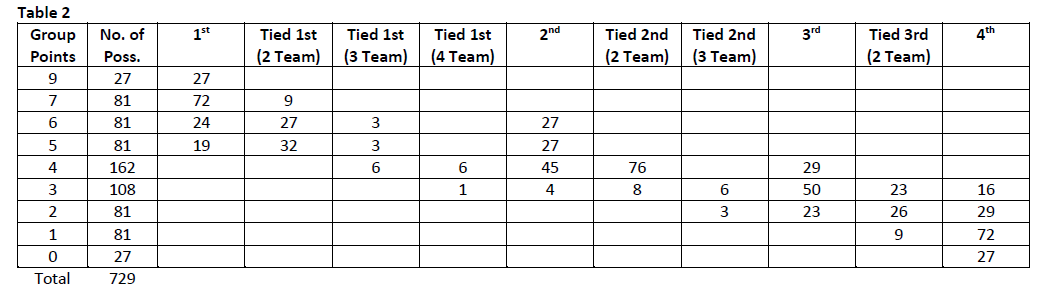
Let’s work through the other possible points outcomes. If a team gets 6 points there is only a 3.7% (3/81) chance they will not be in the top 2 positions in the group. This occurs when three teams end up with 6 points each and one of the teams ends up in 3rd place because of goal difference/goals scored (so the 3.7% is in itself a conditional probability). But a team is guaranteed a top 3 place with 6 points. Interestingly the same outcomes apply for a team that gets 5 points in a group.
The possibilities become much greater when we get to 4 points. A team on 4 points can win a group (on goal difference/goals scored) by either being tied 1st with two other teams (3.7% or 6/162) or tied 1st with all other teams (3.7% or 6/162). They can be 2nd (27.8% or 45/162) or tied 2nd with one other team (46.9% or 76/162) or 3rd (17.9% or 29/162). So if a team gets 4 points the only possibility that they will be outside the top 3 is if they are tied 1st with all other teams and lose out on goal difference/goals scored (3.7% chance of this happening and that again is a conditional probability). If we apply the same logic to a team that gets 3 points this probability increases to 37% (again this is in part a conditional probability and includes a 22.2% or 24/108 chance of either tied 1st with all other teams or tied 3rd place with one other team and losing out on goal difference/goals scored and a 14.8% or 16/108 chance of finishing in 4th place). For a team that gets 2 points the probability of being outside the top 3 places increases further to 67.9%. A team on 1 or 0 points is almost guaranteed to be in last place in the group.
So anything from 4 points up is likely to get us in the top two places in the group and would also almost definitely have us in the top three. Having 3 points would give us a two-third to one-third chance of being in the top 3 while those odds reverse if we were to have 2 points. In short, 4 points or more would be ideal, 3 points might get us there as well while 2 points may not be enough. Anything lower and we are most likely to be out.
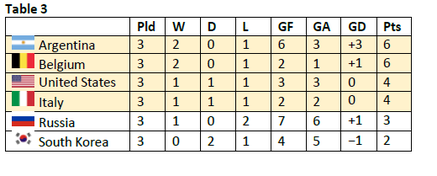
There is one final consideration in this analysis and that is the performance of the 3rd place finishers in other groups. It would be next to impossible to extend the analysis done so far to other groups so instead one can look at history for insight. The World Cups of 1986, 1990 and 1994 all used the same qualifying format as what will be used by Euro 2016. Unfortunately, World Cup 1986 and World Cup 1990 are not directly comparable as they used the old points system of 2 points for a win, 1 for a draw and 0 for a loss. Thus only the World Cup 1994 can be used. The table below displays the ranking of the 3rd place teams in that competition. As can be seen, both Argentina and Belgium came third in their group despite earning 6 points. Both teams lost out on goal difference/goals scored in a 6-6-6-0 points group. Italy also lost out on goal difference/goals scored in a group that finished 4-4-4-4 (a group that also featured Ireland). Russia, despite ending up with 3 points in their group, did not qualify.
The possibilities become much greater when we get to 4 points. A team on 4 points can win a group (on goal difference/goals scored) by either being tied 1st with two other teams (3.7% or 6/162) or tied 1st with all other teams (3.7% or 6/162). They can be 2nd (27.8% or 45/162) or tied 2nd with one other team (46.9% or 76/162) or 3rd (17.9% or 29/162). So if a team gets 4 points the only possibility that they will be outside the top 3 is if they are tied 1st with all other teams and lose out on goal difference/goals scored (3.7% chance of this happening and that again is a conditional probability). If we apply the same logic to a team that gets 3 points this probability increases to 37% (again this is in part a conditional probability and includes a 22.2% or 24/108 chance of either tied 1st with all other teams or tied 3rd place with one other team and losing out on goal difference/goals scored and a 14.8% or 16/108 chance of finishing in 4th place). For a team that gets 2 points the probability of being outside the top 3 places increases further to 67.9%. A team on 1 or 0 points is almost guaranteed to be in last place in the group.
So anything from 4 points up is likely to get us in the top two places in the group and would also almost definitely have us in the top three. Having 3 points would give us a two-third to one-third chance of being in the top 3 while those odds reverse if we were to have 2 points. In short, 4 points or more would be ideal, 3 points might get us there as well while 2 points may not be enough. Anything lower and we are most likely to be out.
There is one final consideration in this analysis and that is the performance of the 3rd place finishers in other groups. It would be next to impossible to extend the analysis done so far to other groups so instead one can look at history for insight. The World Cups of 1986, 1990 and 1994 all used the same qualifying format as what will be used by Euro 2016. Unfortunately, World Cup 1986 and World Cup 1990 are not directly comparable as they used the old points system of 2 points for a win, 1 for a draw and 0 for a loss. Thus only the World Cup 1994 can be used. The table below displays the ranking of the 3rd place teams in that competition. As can be seen, both Argentina and Belgium came third in their group despite earning 6 points. Both teams lost out on goal difference/goals scored in a 6-6-6-0 points group. Italy also lost out on goal difference/goals scored in a group that finished 4-4-4-4 (a group that also featured Ireland). Russia, despite ending up with 3 points in their group, did not qualify.
Therefore if the groups are more competitive, the higher the point’s requirement will become for 3rd placed teams. The opposite is also true, that is, if other groups are less competitive relative to our one, it will increase our chances of qualifying. Here’s hoping therefore to being competitive in our group with at least one win and clear winners/runners-up in other groups.
 RSS Feed