The Economics of Sport
  • Sports Economics
  • About
  • Workshop
  • Selected Publications
  • Book Reviews
  • A Primer on Gaelic Games
  • Upcoming Events
  • Media
  • Education
  • Resources & Links
  • Data

Following Wexford Hurlers

25/7/2014

0 Comments

 
By John Considine
This weekend the 2014 All-Ireland senior hurling quarter-finals take place.  Both games will be played, as a double-header, in Thurles on Sunday.  Dublin play Tipperary in one quarter-final.  The second quarter-final is between Limerick and Wexford.  It will be the fourth week in a row that the Wexford hurlers will be playing.  During that time they have generated a wave of support that should ensure that Semple Stadium is close to full on Sunday.  In fact it has been suggested by Wexford officials and supporters that Croke Park rather than Semple Stadium might have been a better venue.  Wexford County Board Chairman, Diarmuid Devereux, made his view know in the Irish Examiner and on 2FM's Game On.  An examination of the last 21 years of data on Wexford hurling games suggests that it is not clear that it will be Wexford supporters that will swell the numbers on Sunday.

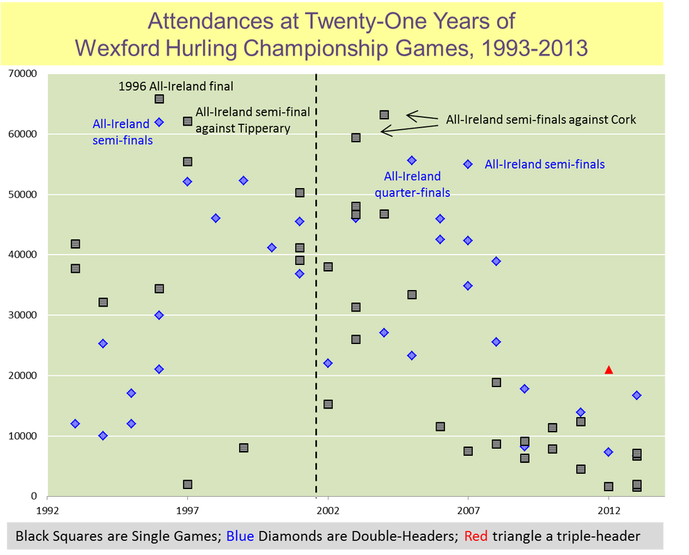
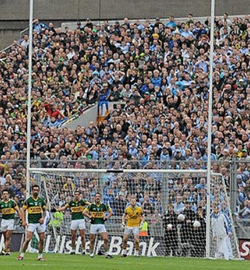
Looking at single games (black squares) in the figure below, it has been 10 years since Wexford followers played in front of a crowd of more than 40,000.  In 2004 a superb last minute goal by Michael Jacob knocked Kilkenny out of the Leinster championship at the semi-final stage.  Wexford beat Offaly in a Leinster final in front of 46,800 spectators.  Wexford supporters travelled in huge numbers to an All-Ireland semi-final where they were heavily defeated by Cork.  A successful Wexford will bring more of their supporters to games.

Between 2004 and 2013 the numbers attending Wexford hurling games have tailed off.  A lack of success and the dominance of Kilkenny contributing to the decline in numbers.  Since 2006 no single game involving the Wexford hurlers has attracted more than 13,000 spectators.  Since 2009 it took a triple-header to get more than 20,000 people through the turnstyles to see the Wexford hurlers.
Picture
The last five years were pretty bleak in terms of success on the field for Wexford.  As a result, Wexford hurling supporters have added little to the revenues of the GAA.  A victory over Limerick on Sunday will change this situation.  However, the GAA revenues as a whole may not increase because Limerick supporters will not follow a Wexford team to Croke Park.

Diarmuid Devereux  made some more interesting observations when he pointed out the limited number of stand tickets available and the timing of their sale.  Wexford were the last of the quarter-finalists to qualify.  Unfortunately, the tickets for the quarter-finals went on sale prior to their qualification.  It is something the GAA should consider for future years.
0 Comments

Win Percentages for Home Teams in Gaelic Games

22/7/2014

 
By John Considine
As Dublin footballers cruised past Laois, Wexford, and Meath on their way to another Leinster football title, a few grumbled about the advantage Dublin get from playing all their games in Croke Park.  To keep matters simple, it would be nice to be able to calculate the percentage of games that Dublin footballers win at home and the percentage that they win away from home.  Unfortunately, Dublin footballers rarely play outside Croke Park.  The size of the Dublin football following means that most grounds outside Croke Park would struggle to hold the crowd wanting to attend (see previous post here).  As an alternative the winning percentages of home teams in gaelic games for the period 2008-11 are presented below.

The numbers in the table below are for the four championship years between 2008 and 2011.  They are based on just over 60% of the senior championship games played in those years because the other 40% of games were played on neutral ground.  Croke Park features prominently in the games held at a neutral venue.  All later stages of the All-Ireland series tend to be held in Croke Park.  This is a neutral venue for all games not involving Dublin.
Picture
Let us ignore the anomaly that is the Connacht (football) championship for the moment. It seems that the home team wins between 50% and 60% of the games. The away team wins between 33% and 44%. It is clear that there is an advantage to being a home team.

Connacht is an outlier. One of the reasons for this is that New York and London play in the Connacht championship. Despite London's heroics in the 2013 championship, it would be fair to say that these teams are the weaker teams in the competition. To help foster the game in these parts of the world, the GAA allow London and New York to play their first games at home. In the period 2008-11 both teams lost their opening game in each year. If these games are removed then the winning percentage for home teams in the Connacht championship is 50% and the away team wins just under 44% of the time.

For the record, Dublin footballers have an impressive 81% win rate in Croke Park over the 2008-11 period.  It would require a more detailed analysis to say how much of this is due to them being a good team and how much is down to home advantage.

Yes, Minister

9/7/2014

0 Comments

 
By John Considine
In various blog posts I have pointed out how the allocation of Irish sports capital grants tend to have a geographical bias towards the county of the Minister for Sport (here, here and here).  It is, therefore, noteworthy that there seems to be an effort on the part of the current minister (Michael Ring) to address the issue in the 2014 round of grant allocations.

The 2014 round of grant allocations were announced last week.  This was the second round of grants made under this minister.  His first round was in December 2012 when he announced the local grants in early December and the non-local grants later in December.  The combined 2012 grant allocations looked as if they conformed to the previous pattern of political geographical bias.  The Minister's county (Mayo) received the third highest per person allocation.  Two other north-west counties (Sligo and Leitrim) filled the top two places when it came to per person allocations.

When the 2014 allocations are combined with the 2012 allocation, the per person allocation of Mayo does not standout from the pack.  Figure 1 below presents the combined allocations made by Minister Ring.  A feature of the allocations is the Minister's "Robin Hood" principle.  Those counties who did poorly between 1998-2011 got a little bit more under this minister (although Sligo and Leitrim remain out of line).  Minister Ring seems to be setting about correcting the previous bias.  He has got some deserved positive comments from the media in this respect (here).

It should also be noted that Minister Ring seems determined to make it clear that there was inappropriate allocations made under previous ministers.  In his usual spirited delivery, the Minister pointed out how a range of previous allocations were classified as "invalid" despite receiving grants.  As part of his reply to Fianna Fail's Timmy Dooley (here) he said,

"In 2007, when Deputy Dooley's party was in Government, the then Minister for Arts, Sport and Tourism set the criteria and officials submitted the eligible applications.  I will outline some of the figures, as follows: Glebe Sport Holdings in Letterkenny was allocated €250,000 - invalid; Baltinglass GAA club, €50,000 - invalid; Kilmanamagh Family Recreation Centre, €175,000 -  invalid; St. Mary's GAA club in Cahersiveen, County Kerry - Deputy Dooley knows
who was Minister at the time - €300,000 - invalid; Farranfore Maine Valley AC, County Kerry, allocated €5,000 - insufficient own funding, invalid"


His reference to St Mary's GAA club is drawing attention to John O'Donoghue of Fianna Fail.  Previous posts have outlined the bias in the allocation when he was Minister for Sport.

There is a Cabinet reshuffle due in the coming days.  Minister Ring may, or may not, be moved from his current position.  Regardless, he can point out that when one looks at the combined 2012 and 2014 grant allocation, he outperformed many of his predecsssors when it came to giving a "fair" distribution to his county.
Picture
0 Comments

A Cycle-to-Work Scheme

4/7/2014

0 Comments

 
By John Considine
Five years ago the Irish government, where the Green Party was the minor coalition partner, introduced a cycle-to-work scheme.  The scheme encouraged individuals to cycle to work by allowing the purchase costs of cycling equipment, up to €1,000, to be offset against income tax.  The Minister for Finance stated that, at the time the scheme was introduced, it was estimated that 7,000 employees would avail of the scheme over the first five years at a costs of €0.4m to the Exchequer.  Unfortunately, in an effort to reduce administration costs, the statistics on the uptake of the scheme were not collected.  Almost three years after the scheme was introduced the Irish Bicycle Business Association produced their Report on the Cycle to Work Scheme Tax Incentive.  The report makes some big claims about the success of the scheme and its contribution to the Irish economy.  It is worth looking more closely at some of these claims.
One of the claims in Section 4.3 of the Report is that the scheme has saved "the Economy €15.3million a year".  This figure is derived by using a daily saving of €170 and multiplying this by "90,000 (new cyclists)".  The Minister for Finance claimed 7,000 employees would take up the scheme whereas the IBBA report suggests there will be 90,000 new cyclists.  That's some difference.  The IBBA Report figures have the advantage of being estimated after the scheme was introduced.  It is unfortunate that the government decided against collecting data on the uptake of the scheme.  It would allow us to validate the IBBA data.  If the 90,000 figure is correct then the scheme could have cost the Exchequer a substantial amount in income tax forgone.  It also raises questions about the forecasting ability of those advising the Minister for Finance.

It would be important to validate this €15.3m figure as it seems to comprise the majority of the total of €19m in benefits from the scheme.

The report also claims that recent research (and a newspaper report from May 2011) shows the "decline in deaths for cyclists over the past decade has been greater than for any other group in the research".  It is difficult to find support for this claim when one looks at the table and figure below.  There has been a welcome improvement in the total number of road fatalities in Ireland.  Road fatalities in 2012 are about 40% of what they were in 2000.  However, the numbers do not support a claim that the decline in deaths for cyclists has been greater than for any other group.
Picture
0 Comments

Adidas, Nike, and Soccer

30/6/2014

0 Comments

 
By John Considine
Brendan Greeley and Bloomberg have produced a documentary on the competition between Adidas and Nike for consumers of soccer sportswear.  The film is called Shootout: Can Nike beat Addidas in Soccer?  Greeley used his friend's sons to introduce a human face to the business side.  For example, he begins by bringing the kids two replica German goalkeeper's jerseys and ends the documentary by showing how the kids make an emotional investment in the game.  Fortunately for Greeley, his friendship, and the health of one of the boys, Greeley displays good hands himself in "saving" one of the kids from going over his shoulder and smashing, face first, into a footpath!
Picture
Nike entered the soccer market in 1994 when the USA hosted the World Cup.  Adidas made its dramatic entry 40 years earlier when its founder contributed to the German victory in Switzerland through the development of screw-in studs on the footwear (cleats to US readers; boots to European readers).  Nike has almost eliminated the 40 year headstart of Adidas.  Last year soccer sales were $2.4bn for Adidas and $1.9bn for Nike.

One of the reasons Adidas maintains its lead is that since 1970 it has sponsored FIFA.  They have just concluded a deal up to 2030 costing them $70m for each four year cycle.  This allows Adidas to put their name on the field and to produce the World Cup ball.  Addidas sold 13 million of the 2010 World Cup footballs and hope to sell even more of the 2014 version.

When it comes to team sponsorship in the Brazil World Cup, Nike hold a slight advantage.  Nike sponsor 10 teams including the hosts, whereas Addidas sponsor 9 teams.  An interesting snippet from the documentary is when Adidas reveal that the most popular national teams shirt by sales is Columbia.

While teams are sponsored as a group of individuals, players retain the rights over what footwear they wish to place on their feet.  This is illustrated by Luka Modric who carries the Nike logo on his Crotia shirt, the Addidas logo on his Real Madrid shirt, but regardless of the team he wears Nike footwear.  Players like Modric promote footwear from one of limited number of lines (or silos).  Heading up the silos are Ronaldo (Mercurial) and Messi (F50).  Greeley and the representatives of Nike and Adidas note that the World Cup performances of Ronaldo and Messi will not fully determine the commercial success of the footwear.  This is because of the range of soccer competitions in which they play and the way technology allows their performances to be seen by their fans.  To illustrate the point, Greeley explains how one of the most successful soccer brands, Zlatan Ibrahimovic, is not even playing in the World Cup.  It means that the battle between Nike and Addidas will continue even after the final in Brazil.

0 Comments

Mike the Gardener

9/6/2014

0 Comments

 
By John Considine
Yesterday, June 8th, marked the fourteenth anniversary of one of the more infamous meetings in competition (antitrust) law.  On that day, some of the key players in the replica shirt business had a short but eventful meeting.  The meeting forms part of the facts in an Office of Fair Trading investigation (here).  The meeting has become famous because of the alleged interaction between Dave Whelan (of JJB & Wigan Athletic fame) and Mike Ashley (of Sports Soccer & Newcastle United fame).  The meeting was arranged to dampen the price war in the sale of replica soccer shirts.  Dave Whelan arrived at the meeting by helicopter.  On disembarking, he got the meeting off to a bad start when he apparently thought that Mike Ashley was the gardener (see paragraph 188 of the OFT Decision).  Things did not get any better when during the meeting Whelan was alleged to have said to Ashley, "there's a club you know in the north, son, and you're not part of it".  Two months later, Mike Ashley decided to blow the whistle on the price-fixing cartel and, therefore, sparked the OFT investigation.
Picture
It seems that in the months prior to the infamous June 8th meeting, Sports Soccer's strategy of discounting replica kit was causing some unrest amongst the retailers.  Paragraphs 157 and 158 details how JJB complained to Umbro (the manufacturer of the replica kit) about such practices and threaten to withdraw orders unless Umbro sorted it out.  Umbro was also coming under pressure from Manchester United to deal with the issue (paragraph 172).

Of particular concern in May/June 2000 was the retail price of the England shirt.  In March, Sports Soccer were selling the shirt at £28.  This was over £10 less than most high-street retailers.  In his witness statement, Mr. Chris Ronnie of Umbro explained how, at a meeting in April, agreement was reached with Sports Soccer to retail the England shirt at its recommended retail price of £39.99.  Sports Soccer continued to discount the England replica shorts and socks.  Mr Ronnie spoke to Mike Ashley in an attempt to get him to stop this discounting.  Initially, Ashley refused. Then Mr Ronnie stopped a delivery to Sports Soccer.  After this delivery was stopped, Sports Soccer sold socks and shorts at the recommended retail price.

Is it any wonder that Mike Ashley was motivated to blow the whistle on the price-fixing?

On June 20th, England were eliminated from the Euro 2000 tournament.  The following day Sports Soccer discounted the England replica shirt to £20.  David Butler has written on this blog about the dissatisfaction surrounding the price of the England shirt for this year's World Cup (here).  If England are eliminated from this year's competition then similar, or greater, discounting will follow.

0 Comments

The Gap in the GAA Scoring Zone

6/6/2014

0 Comments

 
By John Considine
Tomorrow marks the begining of SKY Sports coverage of gaelic games (Kilkenny v Offaly).  When the GAA deal with SKY was announced it provoked much reaction.  One of the more humourous reaction came from the folks at TodayFM's Gift Grub.  Their initial audio offering is dubbed onto visual coverage from SKY's Soccer Saturday and can be viewed in an entertaining YouTube clip (here).  One of the funnier elements is seeing/hearing Phil Thompson struggle to understand the scoring system.

In his first intervention, Thompson calls a shot that goes over the crossbar "a miss" only to be surprised that the player is being congratulated by his teammates. He says "this is a bit queer".  In his second intervention, he struggles to combine the goals and points tally.  He says he is unsure who won the game as one team scored 6 goals and 17 points while the other team scored 3 goals and 23 points.
Picture
It is easy to laugh as Thomo comes to terms with a "foreign" game.  He became a Liverpool legend playing a game where the only scores were goals.  In gaelic games teams can score goals and points.  The GAA website gives the following definition of the scoring space.  "The scoring space is marked in the centre of each end line by two goalposts 6.5m apart, with a height of not less than 7m above ground level. A cross bar is fixed to the goal posts at a height of 2.5m above the ground."  If the ball crosses the end line between goalposts and below the crossbar then the team is awarded a goal.  If the ball crosses the end line between goal posts and above the crossbar the team scores a point.

A goal is worth three points.  Therefore, the team that scores 6-17 defeats a team that scores 3-23 despite the latter getting more scores.  It seems pretty straight forward to GAA people.

Picture
At least that is what I thought until Seamus Coffey a contrary, but intellectually stimulating, colleague asked me if it was fair.  I was stumped.  There were two reasons for my confusion.  First, Seamus has little time for economists who discuss the "fairness" of economic policy.  Yet, here he was raising an issue about the fairness of GAA scoring.  Second, he had presented a question about a scoring system I had happily operated under all my life without questioning.

Seamus wondered why a team would get three points (goal) for a shot 2.4m above the ground, one point for a shot 2.6m above the ground, but nothing for a shot 2.5m above the ground that hits the crossbar and rebounds into play.  He also wanted to know if the GAA was the only sport with such a system where a contestant does not get rewarded for hitting the 'middle' of the scoring zone.  He explained how Australian Rules football splits the scoring zone (see picture above left) but awards a score if the dividing post is hit.  I could only muster the game of darts as a possible comparison with gaelic games.

It seems there is a gap in the GAA scoring zone.

0 Comments

Some Economics of Physical Inactivity

6/6/2014

0 Comments

 
By John Considine
Picture
A recent paper from the British Journal of Sports Medicine includes a frank assessment of the research into the economics of physical inactivity. The 16 authors ask, and answer, the question: “what is the evidence to indicate that interventions can provide value for money?”  They imagine a situation where policy makers ask this question of the exercise medicine community.  And, the answer is … “to date we have limited high-quality health economic evidence for accurately ascertaining the value for money of various intervention strategies targeted at physical activity”.

However, the authors are positive about the potential for new and improved work.  For example, the difficulties with self-reported physical activity can now be overcome with instruments such as “pedometers, accelerometers and devices such as ActivePA1 or GPS”.  Technology can also aid in lowering the cost of community campaigns, e.g. via mass-media and other social media.

Given the research to date, the paper presents the seven best investments for promoting physical activity. These are (1) schools programmes; (2) transportation policies and systems; (3) urban design and infrastructure; (4) physical activity built into primary prevention strategies; (5) public education; (6) community programmes and (7) ‘sport for all’.  When one thinks about it they seem to make a lot of sense.

0 Comments

Core Stability and Ball Performance

4/6/2014

0 Comments

 
By John Considine
Picture
A couple of years ago my colleague Robbie Butler drew my attention to a comparison between baseball and golfball production used in a book called How Rich Countries Got Rich and Why Poor Countries Stay Poor.  In the book, Erik Reinert offers an explanation as to why baseball production has moved to places like Haiti whereas golf ball production has stayed in the United States.  In the course of the explanation, Reinert makes a claim that still astonishes me.  Praised like the Humpty Dumpty nursery rhyme, he said "All the engineers and all the capital of the United States have not managed to mechanize baseball production".  This means it is a labour intensive production process and, therefore, is outsourced to places like Haiti, Honduras and Costa Rica.  "Every baseball is stitched by hand with 108 stitiches, and each worker is able to sew four baseball per hour."  Because golf ball production has a high level of research & development, and direct labour costs of about 15%, it tends to remain in the United States.

Like baseball production, hurling ball production is being outsourced from the country in which the game is predominantly played.  The hurling ball is now being produced in places like Pakistan and China (a brief entertaining account is provided by Josh Chetwynd in his book The Secret History of Balls).  However, it is not just a matter of stitching and costs of production.  There is also a matter of innovation in the production of the core (centre) of the ball.  Ignoring the pun, it was something that was sprung on the GAA about a decade ago as the balls started bouncing to unprecedented heights.  A sample of the media comments are reproduced below (from a PowerPoint presentation from Kevin Cronin and his colleagues here).

Picture
Reacting to the criticism, the GAA set about bringing some consistency to performance of the ball.  On examination, it seems that the key contributor to the new found "life" in the ball was changes in the core - the part that lies inside leather skin.  A share of these new cores were being imported (many with the leather skin already stitched on).

The GAA funded research on the issue.  Some of the research can be found in two papers by Fiachra Collins, Dermot Brabazon and Kieran Moran of Dublin City University (here and here).  Collins, Brabazon and Moran set about examining the impact bahaviour of 4 types of hurling ball core ranging from the more tradition core (80% cork wraped in 20% yarn) to the newer core (100% polyurethane-based polymer).

Previously, the bounce of the ball was tested by dropping it from a height of 1.8m.  The team at DCU developed a testing laboratory that tests the core with various impact speeds, e.g. 5m/s of 20m/s.  An impact test is illustrated directly below.
Picture
The results of the tests showed that there was less variation in the modern ball types when compared with the traditional ball types (although my engineering colleagues tell me there are a few caveats).  Therefore, as the core of the ball changed there was massive variation in performance while the traditional ball was used side-by-side with the modern ball.  Now that virtually all balls have the modern core the stability of the performance has improved.  The new balls may bounce higher but there is a consistency to their movement that was not their previously.  Players have adapted and the game moves on.
0 Comments

Drive for Dough

3/6/2014

0 Comments

 
By John Considine
Almost twenty years ago Bob Rotella published his best-selling book Golf Is Not A Game of Perfect.  Rotella's background is psychology and it was his application of psychology to golf that brought him to sporting prominence.  Tom Kite wrote the foreword for the book and he testifies to the important influence Rotella had on his career.  In chapter 9 Rotella lists an impressive range of golfers who have benefitted from redirecting their attention away from their long-game towards their short-game.  But he admits there are some golfers that he cannot help improve.  He says about such a player, "this is a player who cannot accept the fact that low scores depend on how well a golfer plays once the ball is within about 120 yards of the hole. This is the player who persists in thinking that golf is about who hits the longest drives or the prettiest 3-irons".

Picture
Rotella might revise his views given the changes to the Professional Golfers' Association Tour in the meantime.  According to a recently published paper in the Journal of Sports Economics, the average length of the golf courses on the tour has increased, the height of the rough has been reduced, cups have been repositioned to harder locations, while there has been no increase in the number of bunkers.  The authors suggest that these changes should have increased the returns to driving relative to putting.  Examining the data, the authors of the paper find that this is in fact the case.  Carson Baugher, Jonathan Day and Elvin Burford find that prior to 2011, putting ability was the most important determinant of earnings.  In 2011 this changed with driving distance becoming the most important determinant of earnings.  Putting slipped to second place in 2011 and remained there in 2012.  In 2013 putting slipped to third behind driving distance and driving accuracy.

A key year in their analysis is 2008 when "the average length of the golf course on the PGA Tour increased by 37.4 yards".  From that year there is a dramatic increase in the returns to driving length and accuracy.

To illustrate their argument on earning they compare the 2013 earnings of Bubba Watson and Bryce Molder.  Watson was the 5th longest driver and 122nd best putter.  Molder drove the ball 14 years less than the average golfer but was the 4th best putter.  Watson earned $1.8m while Molder earned $0.8m.  Eight of the top 10 drivers earned more than $1m whereas only 5 of the top 10 putter earned over $1m.

Carson, Day & Burford suggest that the old saying "drive for show and putt for dough" should be replaced by "drive for dough in order to putt for dough".

The evidence presented in the paper is not incompatible with Rotella's views.  However, it clearly attaches a greater importance to driving than one might get from Golf Is Not A Game of Perfect.  One of the things I found most interesting about the paper is my reaction to it.  If someone asked me to guess which of two golfers earned more money, and they said one was a better driver while the other was better from 120 yards to the hole, then I would go with the golfer that was better over the last 120 yards.  I find it hard to rationalise my choice.

0 Comments
<<Previous
Forward>>

    Archives

    March 2023
    February 2023
    January 2023
    December 2022
    November 2022
    October 2022
    September 2022
    August 2022
    July 2022
    June 2022
    May 2022
    April 2022
    March 2022
    February 2022
    January 2022
    December 2021
    November 2021
    October 2021
    September 2021
    August 2021
    July 2021
    June 2021
    May 2021
    April 2021
    March 2021
    February 2021
    January 2021
    December 2020
    November 2020
    October 2020
    September 2020
    August 2020
    July 2020
    June 2020
    May 2020
    April 2020
    March 2020
    February 2020
    January 2020
    December 2019
    November 2019
    October 2019
    September 2019
    August 2019
    June 2019
    May 2019
    April 2019
    March 2019
    February 2019
    January 2019
    December 2018
    November 2018
    October 2018
    September 2018
    August 2018
    July 2018
    June 2018
    May 2018
    April 2018
    March 2018
    February 2018
    January 2018
    December 2017
    November 2017
    October 2017
    September 2017
    August 2017
    July 2017
    June 2017
    May 2017
    April 2017
    March 2017
    February 2017
    January 2017
    December 2016
    November 2016
    October 2016
    September 2016
    August 2016
    July 2016
    June 2016
    May 2016
    April 2016
    March 2016
    February 2016
    January 2016
    December 2015
    November 2015
    October 2015
    September 2015
    August 2015
    July 2015
    June 2015
    May 2015
    April 2015
    March 2015
    February 2015
    January 2015
    December 2014
    November 2014
    October 2014
    September 2014
    August 2014
    July 2014
    June 2014
    May 2014
    April 2014
    March 2014
    February 2014
    January 2014
    December 2013
    November 2013
    October 2013
    September 2013
    August 2013
    July 2013

    About

    This website was founded in July 2013.

    RSS Feed

    Categories

    All
    American Football
    Athletics
    Baseball
    Basketball
    Behavioural Economics
    Boxing
    Broadcasting
    Competitive Balance
    Cricket
    Cycling
    Darts
    David Butler
    Declan Jordan
    Drugs
    Ed Valentine
    Epl
    Esports
    Expenditure
    F1
    Fifa World Cup
    Finances
    Funding
    Gaa
    Gaelic Games
    Gambling
    Game Theory
    Gary Burns
    Geography
    Golf
    Greyhound Racing
    Guest Posts
    Horse Racing
    Impact Studies
    John Considine
    John Eakins
    League Of Ireland
    Location
    Media
    Mls
    Mma
    Olympics
    Participation
    Paul O'Sullivan
    Premier League
    Regulation
    Research
    Robbie Butler
    Rugby
    Simpsonomics
    Snooker
    Soccer
    Spatial Analysis
    Sporting Bodies
    Stephen Brosnan
    Swimming
    Taxation
    Teaching
    Technology
    Tennis
    Transfers
    Uefa
    Ufc
    World Cup
    Wwe

Related

The website is not formally affiliated to any institution and all of the entries represent the personal views and opinions of an individual contributor. The website operates on a not-for-profit basis. For this reason we decline all advertisement opportunities. 

Contact

To contact us email sportseconomics2013@gmail.com or find us on Twitter @SportEcon.