The Economics of Sport
  • Sports Economics
  • About
  • Workshop
  • Selected Publications
  • Book Reviews
  • A Primer on Gaelic Games
  • Upcoming Events
  • Media
  • Education
  • Resources & Links
  • Data

Despite a record win by the USA, goals are harder to get at the Women's World Cup

10/6/2019

0 Comments

 
by Declan Jordan
Picture
The FIFA Women's World Cup in France continues to throw up great games and surprises. The women's game is in the spotlight and, while the football has been great, there are frustrations at FIFA's organisation and commitment to the game, pay inequality, and sexism.

It is perhaps unavoidable that the competition and women's football generally is compared to the men's equivalent. It is not difficult to find patronising commentary on television and in print media whenever women's football is covered. There is almost surprise, particularly in the Irish and UK coverage with which I am most familiar, that professional athletes are technically skillful, competitive, and committed. (There are similarities in the treatment of female football analysts, referred to by Alex Scott here. That it is surprising that someone who has played 140 times for her country should be insightful about the game says a lot about our attitudes to women in football).

Perhaps these attitudes are based on an outdated notion of the women's game, though there are certainly socialised stereotypes at play as well. In a recent article in the Irish Examiner, Larry Ryan referred to a comment by England striker Toni Duggan that she was somewhat heartened to see the anger from opposition fans when she celebrated a goal she scored for Barcelona. For her it showed that the game mattered and the players were being taken seriously. The article though warns that the women's game should try to avoid going down the road of the men's game and should instead try to hold on to the values of inclusion, loyalty, and community.

This doesn't mean of course that the women's game will not get more competitive, skillful, and demanding.

The negative stereotypes will take time to break down of course, but it is interesting to review the data on previous World Cup Finals, both women's and men's, to shed some light on the game's development.The USA's 13-0 demolition of Thailand has led to some suggestions that the World Cup is losing credibility and the increase in teams from 16 to 24 will damage the tournament with more one-sided games.

The data doesn't back this up however.

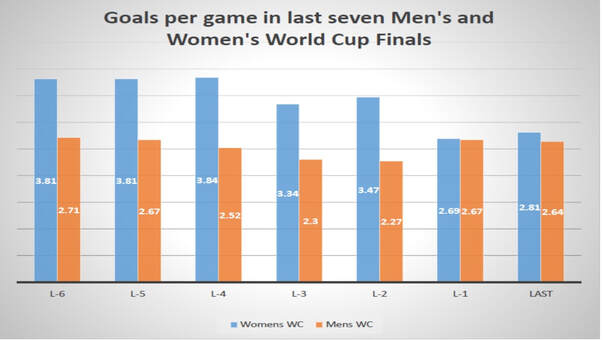
The graph below shows the goals per game at each of the last seven World Cup Finals tournaments (the last men's tournament was 2018 in Russia and the last Women's tournament was in 2015 in Canada). For information, in the first round of group matches in the current tournament (12 in all) to Tuesday June 11, there have been 3.17 goals per game. Excluding the USA-Thailand game the ratio is 2.27 goals per game).

It is striking how the ratio of goals per game has declined over the seven tournaments. From having just over a goal more per game, the women's tournament has now reached a comparable level with the men's. Whether this is a positive or negative development is unclear, though even as the number of countries in the finals of the Women's World Cup has increased goals have become more difficult to come by.


Picture


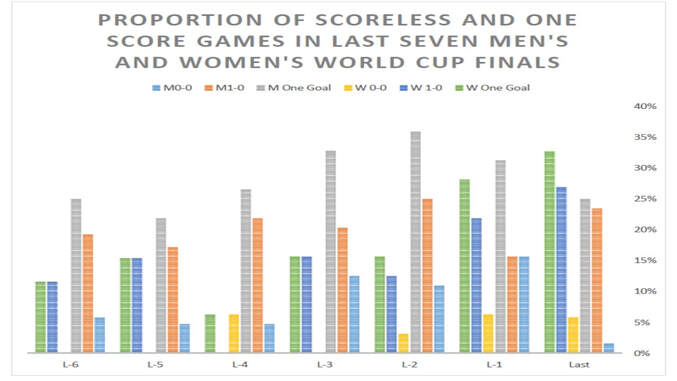
Similarly with the number of low-scoring games, there has been a narrowing in the differences between the tournaments over time. The Women's World Cup Finals did not see a scoreless match until the final day of the third World Cup (in 1999) when both the third place play-off and the final ended nil all. Up to the last World Cup finals there have been nine scoreless matches. There has been one more in current tournament when Argentina parked the bus against the favoured Japanese. In comparison over the last seven men's tournaments there has been an increase in scoreless matches from close to 5% of matches to 15% in 2014. In 2018 there was only one scoreless match.

It is interesting though to include the number of games that have ended 1-0. The green bar in the graph below shows the proportion of matches that have had one goal or less (within 90 minutes). The women's World Cup has gone from about 12% of matches in the first tournament in 1991 (and only 6% in 1999) to a third of matches in 2015. (A third of the 12 games in the current tournament have had one goal or less). 

​The grey bar shows the corresponding data for the men's tournaments. Rising from 1994 to 2010 before falling in 2014 and 2018, the level has been between about a quarter and a third. The women's rate has exceeded the men's in the most recent tournament. 

It may be that the fewer number of participants in the women's finals means the best teams are playing and the matches are closer. The number of teams taking part increased however in 2015 from 16 to 24. Adding the extra teams has not diminished the closeness of the games (measured by the proportion of low scoring games). It may instead point to an increase in standards - or at least a decrease in the variability of standards - at the elite level and the women's game converging with the men's game, whether for good or ill.

The data may also point to greater levels of organisation in coaching and associated resources from national bodies for the women's national teams, and further posts may explore that idea.
Picture
0 Comments

Could Paris Win The World Cup?

19/6/2018

 
By Robbie Butler,

The title of this post is not a mistake. Rather it is driven by an overview (see here for full piece) of player nationality and region of birth at World Cups since 2002. This in-depth work explores the past four World Cups and the current tournament and finds that France has been most successful at producing players to perform at the tournament.

Since Korea and Japan, France has provided 216 players at five world cups. While more than half have represented their country of birth, squad limits of 23 mean that 100+ have represented other nations. This is no doubt a consequence of France's colonial past. Players born in the country have put many international jerseys on, including the likes of Senegal, Tunisia, Algeria and Ivory Coast. 

As we head towards the end of Week 1 at the 2018 World Cup, it is interesting to examine a possible team that the city of Paris could field. The eleven would include the likes of Bernard Mendy, N'golo Kante, Paul Pogba and Kylian Mbappe. What is even more remarkable is the fact that the team could include the likes of Anthony Martial, Riyad Mahrez and Kingsely Coman, none of which made it to Russia.

From an Irish perspective, 12 players born on this island, make the overall list. This might appear to be low and places the country second last behind Iceland, Togo, Panama and Trinidad and Tobago. This can be explained by a number of factors.

​Firstly, the Irish team last reached the World Cup finals in 2002 so there is a single observation. Secondly, as the world's first colony, Irish squads are often dominated by players who's parents and grandparent migrated to England, Wales and Scotland. Lastly, migration to Ireland is a relatively new phenomenon. In fact, this did not significantly start until the early 2000s. However, things might be about to change. Most migration to Ireland in this time has come from Eastern Europe and West Africa. Children born in this country, whose parents emigrated to Ireland, could now be as old as 17 or 18. In the not too distance future we may start to see children born in places such as Dublin and Cork represent countries like Poland, Latvia, Nigeria and Ivory Coast. 

And of course, we would also argue that the Irish figures should be higher, and France around 20 lower. We haven't forgotten about Thierry Henry and that handball in Paris in 2009. I don't think we ever will. 

A "World" Cup Finals?

8/6/2018

 
By Robbie Butler,

​We are now just days away from the start of the 2018 FIFA World Cup Finals. The word "finals" is important. 211 teams have participated in the 2018 World Cup with qualifying starting in Africa as early as the 12th of March 2015.

Unfortunately I am only too aware of when qualifying ended for the tournament in Europe. It was Tuesday the 14th of November 2017. I sat in the Aviva Stadium, Dublin and watched Denmark take the final UEFA spot in Russia at the expense of the Republic of Ireland.The following day Peru claimed the final spot beating New Zealand in a play-off. We will revisit Peru shortly.

As an Irish supporter it is frustrating to finish 2nd in a qualifying group, ahead of two teams ranked 10th and 15th in the FIFA World Ranking at the time of the draw, only to face the 19th best team globally in a play-off. 

I have previously shown how it is becoming harder for UEFA members of qualify for the World Cup. Even expansion in 2026 will do little to help the European cause. Some might argue UEFA have the best deal of all. There will be 14 teams at the Finals this summer from the confederation. This includes hosts Russia and is almost treble that of any other FIFA confederation. The pie chart below presents the breakdown for the 2018 Finals.
Picture
Just five of the six confederations are represented. This is because no OFC (Oceania) country managed to qualify. This confederation represents 14 countries and the failure to qualify  does beg the question of whether this truly is a "world cup".

Having watched this tournament, with clear memory since 1990 (I do recall the final in 1986), it seems natural inequalities play a role when qualifying.

Geographic location on this planet is very important. Outside of Europe countries such as South Korea, Japan, Mexico, Brazil, Argentina and USA (although not this time round) seem to appear every four years. Brazil in fact are the only country to have played at all 21 World Cup finals. The CONMEBOL qualification system plays a huge role in this regard. The graphic below presents the number of teams eliminated versus those qualifying from each confederations for the 2018 Finals. South America is an obvious outlier. 

Picture
CONMEBOL members will benefit from the expanded tournament, starting in 2026, when a 6th place with be available in South America. That means more teams could play at the finals, than are eliminated in regional qualifying. Maybe it is the fear of the likes of Brazil or Argentina not qualifying (as is the case with Italy this time round) but one has to spare a thought for African, Asian and Central/North American FIFA members. 135 of these nations started out in qualifying. More than 90% (122) won't be in Russia. 

Peru, a country that lost 6 games in qualifying, will line out against Denmark on the 16th of June. The country qualified with a total of 26 points from 18 games, an average of just points per game 1.44. Northern Ireland and the Republic of Ireland had an average return in qualifying of 1.9. Italy's was 2.3. 

Switzerland finished second in UEFA qualifying Group B with 27 points. The Swiss then had to win a two-legged playoff against Northern Ireland to qualify. Colombia finished 4th in CONMEBOL with 27 points and qualified directly for the finals. 27 points from 18 games. In fact, the Swiss got more points from 10 games then Peru did from 18!

​If only Ireland was in South America...

FIFA World Cup 2018 - The Russian Party

5/6/2018

 
By Robbie Butler,

For the next 10 days the posts on this blog will focus on the FIFA World Cup which is due to kick-off in the Luzhniki Stadium, Moscow on Thursday 14th of June. This is the first time Russia has hosted either of the big two football tournaments. Games will be played across 11 different cities, spanning a huge geographical area, from Kallingrad in the west to Yekaterinburg in the east. The distance between these two cities is almost 2,500 km (1546 miles). That is roughly the same as Cork to Sofia in Bulgaria.

Like all major events, the tournament is likely to cost more to the Russian state than is recouped in revenue. However, FIFA suggest that the benefits lie elsewhere. According to the government bodies Russian's can look forward to the following:

"Some of the benefits experienced by host countries of FIFA competitions include:
  • A catalyst for new and improved facilities to support the development of the game at all levels;
  • Increased number of and higher quality football development programmes for both the elite game, talent identification and grassroots;
  • Increased cooperation and goodwill between the various stakeholders – the member association, the government and other bid stakeholders such as the bid host cities, commercial partners, the media and the community at large;
  • Increased civic pride and community empowerment as groups of stakeholders get to contribute to and support the bid, together with new skills and training for those involved in delivering the event;
  • Enhanced partnerships and greater commercial activity and investment from new sponsors, media, broadcasters and large corporations;
  • Help in breaking down social barriers to participation and high performance by both women and young people;
  • Using successful players as role models to encourage young and emerging players and to promote health and other social benefits”.

Two notable studies have looked at the feel-good factor associated with hosting the world’s biggest football tournament. Maenning and Sussmuth (2007) examined the 2006 World Cup in Germany and found locals were happier after hosting the tournament. In former East Germany the effects were found to be greatest, particularly among the less-well educated. Kavetos and Szymanski (2004) consider a longitudinal data set from 1978 to 1994. Using happiness data from the Eurobarometer Survey the authors found that hosting a tournament has a positive, significant effect on a country’s happiness, both during and after the Finals. As one might expect, those under 50, males, the unemployed and less educated saw the greatest jumps in happiness.

The happiness of the Russians might depend on how long the their team stay in the competition. At odds of around 40/1 to win the tournament that may not be too long...

World Cup 2018 Qualification

27/3/2017

0 Comments

 
By Robbie Butler

At the start of the year I had an entry about the ever-expanding World Cup Finals and attempted to put some logic behind FIFA's plans to increase the number of teams at the Finals in 2026.

​Prior to this weekend's world cup qualifying fixtures, I read a Sky Sports article focusing on the potential of a World Cup without Argentina. Since the weekend, the chances of this have reduced thanks to a Lionel Messi penalty in a 1-0 win over Chile. The current qualifications standings are below.
Picture
Between 4 and 5 teams can qualify from this confederation. In percentage terms, this is far better than any other confederation. For example, if this were the end table, Ecuador could still qualify despite losing five games. No UEFA country could expect to qualify with this loss rate. Even controlling for the number of games played, five defeats in CONMEBOL qualifying would compare to almost 3 defeats in UEFA qualifying. I doubt any European country that loses three games will make a play-off, let alone qualify for the tournament in Russia.

The South America countries have things much more straight-forward, and not just over the European. The table below shows the percentage of countries that have qualified from each confederation since the World Cup 
Picture
​expanded to 32 teams in 1998. European countries have the second highest number of teams qualifying as a percentage of the number of entrants. 

The decision to increase the number of teams for further tournaments has been met with much criticism, and raised issues of the quality of teams that could now reach the finals. If 16 additional countries are to be given places, surely Africa, Asia, Oceania and North and Central American countries should be first in the queue. The quality may not improve but the distribution of places will be much closer to a model consistent with a "World Cup". 

0 Comments

The Ever-Expanding World Cup Finals

18/1/2017

0 Comments

 
By Robbie Butler

FIFA recently announced that the World Cup Finals will be expanding from 32 teams to 48 for the 2026 World Cup. This decision has been largely criticised. Fears of diluting the quality and player burn-out are commonly cited as reasons to oppose the move.

From the organiser’s perspective, the World Cup is big business. Broadcasting revenue alone from the most recent tournament in Brazil was worth $2.4 billion. In total, FIFA made a profit of approximately $2.6 billion from the 2014 tournament. Expanding the tournament seems like a no-brainer.
​
There is another reason to expand the competition, which has been rather overlooked. There are many more national associations now than there were even twenty years ago.

​A historical analysis of previous World Cup qualifications can help understand the evolution toward greater numbers of national associations. Starting in 1934 (the inaugural tournament in 1930 was invitation only), 1 out of 2 countries entering the qualification stage reached the Finals in Italy. This ratio has never been topped. The graph below plots the number of entrants, number of team qualifying (left-hand axis) and the percentage of countries qualifying (right-hand axis) from 1934 to 2026 (assuming the number of associations remains at 210 for the 2022 and 2026 tournaments). 
Picture
The expansion to 48 countries means just over one-fifth of all entrants will reach the finals. The 1982 expansion to 24 teams, and the 1998 expansion to 32, were outpaced by the rapid increase in associations, particularly in UEFA following the collapse of the Soviet Union and break-up of Yugoslavia.
​
Consider the UEFA confederation alone is worthwhile.

From a European perspective, an increase in the number of UEFA places must be a priority. The second graph below shows just how hard it has become to qualify for the World Cup as a UEFA member, with just 13 places for 54 countries trying to get to Russia 2018. This compares very poorly to the 13 spots available for Italia ’90 when just 33 countries entered the qualification phase. 
Picture
Almost 40% of UEFA countries entering the qualification stage reached the finals in 1990. With an identical number of places, just 24% of associations will be at Russia next year. ​Commentators can criticise the move, but let us not ignore the explosion in the number of FIFA and UEFA members. 
0 Comments

Relative Age Effects and Player Position

23/9/2016

0 Comments

 
by Declan Jordan
​One of the explanations for the persistence in relative age effects in sport is the physiological benefits that players born closer to the age cut-off for under-age competition (usually earlier in a calendar year) have over players born later in the period. At a young age this can mean up to almost a year in the development of players in the same age category. This physiological advantage may be compounded by the advantages of getting more game time and subsequently more coaching. This could mean some young players dropping out of the game, leading to a persistent age effect.

In football this physiological difference may be more beneficial in different positions. For example, goalkeepers tend to be taller than outfield players, and defenders also tend to be taller and bigger than midfielders and attackers (we can of course think of many midfielders and attackers that are tall and big).

The graphs below show the breakdown of quarter of birth for elite under-17 footballers - i.e. those representing their countries at FIFA U-17 World Cup Finals between 2007 and 2014. There are four tournaments each for male and female players over the period. The data comes from FIFA and player position is designated on the website for each tournament.

The figures show, from the flatter distribution of the female players, that relative age effects are far more pronounced for males than for females.   
Picture
Picture
Picture
However, within each cohort there is no difference in the relative age effect across different positions. This means that the proportion of players in each cohort born in each quarter of the calendar year is similar to proportions in each field position. This suggests that physiological differences at early stages of development may affect the likelihood of selection (and subsequent coaching attention) in every position. Unlike rugby, it seems there isn't a position for all body shapes in football. Perhaps an interesting question would be to look at relative age effects by position in a sport like rugby, where physical size matters for different positions.
0 Comments

Age Effects in African Under Age Football

31/8/2016

 
by Declan Jordan
The news that broke recently that all but two of Nigeria's Under-17 first team failed age tests for the forthcoming African Cup of Nations was shocking, but not surprising. Nigeria have been remarkably successful in the last decade at U-17 level. Nigeria won the U-17 World Cup in the last two tournaments in 2013 and 2015. They were runners-up in 2009 (when they hosted the tournament) and won as well in 2007. They have won the competition 5 times in all.

However, there have been question marks about Nigerian players' true ages for many years now. Indeed there are strong suspicions that African football,and to a lesser extent other regions, have flouted the age rules for many years. In the 2013 tournament, 3 players from each of Morocco, Congo, and Nigeria were sent home from the U17 World Cup for failing the age test. In 2009 MRI bone scans were introduced to test players were the age they claimed to be.

It may not be surprising that countries would want to use older players, since there is a physical advantage for older players in underage tournaments. Indeed, there is a substantial literature on the 'relative age effect', a topic on which my colleagues on this blog have published research. FIFA rules dictate that a player is eligible for a competition if he or she was born in the designated calendar year, so for the U17 tournament in 2015 players must have been born on or after 1 January 1998 (17 years previously). This means players born earlier in the year (in January for example) can have up to 12 months age advantage (and associated physical advantage) - details on player eligibility is available on page 20 here. There is now substantial evidence that football squads are over-represented by players born in the early months of a calendar year relative to the general population.

What might be expected is that countries who are looking to enter players who are older than they actually are is that they would state an age earlier in the calendar year. For example, in this article it is reported that the Syrian squad for the U19 World Cup in 2012 included six players born January 1, 1993 and that the entire team had January birth dates. That approach seems to be a little bit obvious of course, so perhaps it would be better not to draw attention to your squad by spreading the month of birth out.

The graphs below show the profile of month of birth (by quarter) for four editions of Men's and Women's U-17 World Cup Finals from 2007 to 2014. There are 24 countries in the Men's World Cup and 16 in the Women's. It is noticeable that the age dispersion is greater for women, more players are born in the later quarters of the year (the difference is statistically significant). The graphs show quite a remarkable difference between the dispersion for Nigerian squads and other squads (excluding Nigeria). Nigeria appeared in all of the four Women's Finals and three of the four Men's Finals. The graphs show that Nigeria had a statistically different month of birth distribution than the average of the other countries.
Picture
Extending the analysis to look at regional differences in relative age effects, the tables below show the classification of players by the half of the year in which they were born (January to June or July to December) for each global region.
Picture
Africa stands out as the only continent that shows a greater proportion of players born in the second half of the calendar year (the only exception is Oceania for the Women's Finals). The proportion born in the second half of the year is higher for African countries in the Women's Finals. Again, the difference between regions for men and women is statistically significant. 

It is difficult to know the reasons for Africa's exceptional result. If age fraud is a substantial problem there then perhaps the ages being registered are designed to deflect attention by having much less January birthdates. It may be that the birthdate registered is less important where it is different than an actual birthdate. In the absence of age fraud, perhaps there is less physical difference between African athletes of less than a year's age difference, or perhaps African football has avoided the traps of other countries that tend to select more older players and thereby lose younger players to the game. These latter explanations though would likely result in a flat distribution (similar to the dispersion of months of birth in the general population) rather than having such a large proportion in the second half and final quarter of the calendar year.

How was Russia 2018 for you? Stacking the odds against Africa

2/11/2015

0 Comments

 
by Declan Jordan
Picture
​In a recent post my colleague Robbie Butler raised the thorny issue of FIFA country rankings. He bemoaned the problem of countries achieving a higher world rank than should perhaps be warranted because some countries will play more competitive matches against tougher opposition because of their continental affiliation than others. He’s right of course. But the problem of games against tougher opposition is perhaps one that some countries might welcome.
 
The FIFA ranking (or to give them their full title the FIFA/Coca Cola World Ranking) is largely a marketing exercise and is of little consequence. Teams from different continents rarely play each other. In the World Cup finals, teams from various continents are generally kept apart in the group stage draw. This means the overall ranking has little impact, with a country’s position relative to other countries in the same confederation being the critical aspect. For this reason, comparing positions across confederations is of limited value.
 
It does however prompt comparison of how countries accumulate ranking points and inevitably calls into question the conduct of competitive qualification tournaments in each confederation. I have written before about my views on the unfairness of the African qualification process relative to Europe and South America. The African and European contexts are similar to the extent that both confederations have about the same number of affiliated members (54 and 55 respectively). The root of the unfairness lies in huge disparity between the number of qualifiers each continent has – Europe 13 has spaces (not including hosts Russia) and Africa has 5.
 
The African qualifying campaign for Russia 2018 has already begun, and for 13 countries has already ended. In the middle of this month it will have ended for another 20 countries – this is 30 months before the finals will be held. For me this was brought home when looking at the fixtures for my football-mad son, who is Ethiopian, and seeing that they managed to overcome Sao Tome e Principe after being surprisingly beaten 1-0 in the first leg. Their reward is a game against Congo (the eighth ranked African team) in two weeks' time. It seems he has a much better chance supporting Ireland.

Could football fans and national associations in Europe countenance a situation where the lowest 26 ranked teams would have a play-off to continue with World Cup qualifying and risk being eliminated from the World Cup in October 2015 for a 2018 World Cup Finals tournament? The bottom 26 nations in Europe currently includes Turkey, Serbia, Hungary, Bulgaria, Finland, Norway, and more importantly the Republic of Ireland.
 
The first play-offs in Africa were held last month and 13 countries have been eliminated from the 2018 World Cup – having played two matches, one at home. The second round puts the 13 winners from the first round with the remaining 27 African nations who play in a home and away qualifier – the 20 successful teams will progress to play in five groups of four teams with the winner of each group going to the finals in Russia. This means the majority of African countries (33 out of 53 in the current campaign) have less than four World Cup qualifying matches and two at home. 
 
(This contrasts hugely with the South American qualifying campaign where teams play 18 games in a league format with the top four  In fact, Ecuador and Uruguay both won less than half of their matches (7 from 16) in qualifying for the 2014 World Cup – there were 16 games in qualifying last time because Brazil qualified as hosts).
 
The argument of course is that the European teams are better and so deserve more places at the finals (one hopes it is not based on market size or Asia and Africa will soon be entitled to a lot more spaces on that criteria). The FIFA rankings can be used to justify the superiority of the European (and South American) nations. However, this is a circular argument where nations can achieve more points by playing more competitive games, with some of them against higher ranking teams). Playing these (and more of them) fixtures makes teams better – or at least gives them an opportunity to improve more rapidly. Is it possible that Wales’ dramatic improvement from 112th in the world in 2010 to 8th in 2015 could have been achieved in a qualifying environment like Africa’s? This shows the benefit of having games against the 'best' to develop players at international level.

0 Comments

The Tiny Gulf State

25/3/2015

 
By Robbie Butler

I recently spoke about the challenges facing the Qatar 2022 World Cup, the first World Cup in history not to be played during the traditional, Northern Hemisphere summer months. Both FIFA and the organisers in Qatar have gone to great lengths to explain the need for the switch, and argue that football simply cannot be played in conditions of 45 -50 degrees Celsius during the months of June and July in the tiny Gulf state.

And therein lies another problem. Qatar is tiny by global standards. 

Depending on what you classify as a country, Qatar comes in as the 164th biggest state on the planet, one place behind the Falkland Islands! Since the World Cup went to a sixty-four game tournament in 1998 thirty-two teams have competed in the Finals. World Cup Finals have been staged in France (1998), Korea & Japan (2002), Germany (2006), South Africa (2010) and Brazil (2014). The illustrations below show how Qatar (purple) compares in terms of its geographic size to each of these former hosts (pink).
Picture
Picture
Picture
Picture
Picture
Picture
Picture
Another problem is surely the location of the twelve proposed hosting venues, spread across seven locations six of which are located on the eastern side of the Qatar Peninsula.  Doha (4) and Al Rayyan (3), which lie just 55km away from one another, will together provide seven of the stadia for the event. The locations of Al Daayen, Al Khor, Ash-Shamal, Al Wakrah and Umm Salal will each provide one stadium.  

Finally, just for the Irish perspective, here’s how Qatar compares to Ireland. Ireland (70,273 km²) is 6.07 times as big as Qatar (11,571 km²). In fact, counties Cork and Kerry combined cover some 12,300km², roughly 760km² more than Qatar.

Picture
Maybe this Rugby World Cup bid isn’t a bad idea after all…;-)
<<Previous

    Archives

    February 2023
    January 2023
    December 2022
    November 2022
    October 2022
    September 2022
    August 2022
    July 2022
    June 2022
    May 2022
    April 2022
    March 2022
    February 2022
    January 2022
    December 2021
    November 2021
    October 2021
    September 2021
    August 2021
    July 2021
    June 2021
    May 2021
    April 2021
    March 2021
    February 2021
    January 2021
    December 2020
    November 2020
    October 2020
    September 2020
    August 2020
    July 2020
    June 2020
    May 2020
    April 2020
    March 2020
    February 2020
    January 2020
    December 2019
    November 2019
    October 2019
    September 2019
    August 2019
    June 2019
    May 2019
    April 2019
    March 2019
    February 2019
    January 2019
    December 2018
    November 2018
    October 2018
    September 2018
    August 2018
    July 2018
    June 2018
    May 2018
    April 2018
    March 2018
    February 2018
    January 2018
    December 2017
    November 2017
    October 2017
    September 2017
    August 2017
    July 2017
    June 2017
    May 2017
    April 2017
    March 2017
    February 2017
    January 2017
    December 2016
    November 2016
    October 2016
    September 2016
    August 2016
    July 2016
    June 2016
    May 2016
    April 2016
    March 2016
    February 2016
    January 2016
    December 2015
    November 2015
    October 2015
    September 2015
    August 2015
    July 2015
    June 2015
    May 2015
    April 2015
    March 2015
    February 2015
    January 2015
    December 2014
    November 2014
    October 2014
    September 2014
    August 2014
    July 2014
    June 2014
    May 2014
    April 2014
    March 2014
    February 2014
    January 2014
    December 2013
    November 2013
    October 2013
    September 2013
    August 2013
    July 2013

    About

    This website was founded in July 2013.

    RSS Feed

    Categories

    All
    American Football
    Athletics
    Baseball
    Basketball
    Behavioural Economics
    Boxing
    Broadcasting
    Competitive Balance
    Cricket
    Cycling
    Darts
    David Butler
    Declan Jordan
    Drugs
    Ed Valentine
    Epl
    Esports
    Expenditure
    F1
    Fifa World Cup
    Finances
    Funding
    Gaa
    Gaelic Games
    Gambling
    Game Theory
    Gary Burns
    Geography
    Golf
    Greyhound Racing
    Guest Posts
    Horse Racing
    Impact Studies
    John Considine
    John Eakins
    League Of Ireland
    Location
    Media
    Mls
    Mma
    Olympics
    Participation
    Paul O'Sullivan
    Premier League
    Regulation
    Research
    Robbie Butler
    Rugby
    Simpsonomics
    Snooker
    Soccer
    Spatial Analysis
    Sporting Bodies
    Stephen Brosnan
    Swimming
    Taxation
    Teaching
    Technology
    Tennis
    Transfers
    Uefa
    Ufc
    World Cup
    Wwe

Related

The website is not formally affiliated to any institution and all of the entries represent the personal views and opinions of an individual contributor. The website operates on a not-for-profit basis. For this reason we decline all advertisement opportunities. 

Contact

To contact us email sportseconomics2013@gmail.com or find us on Twitter @SportEcon.