The Economics of Sport
  • Sports Economics
  • About
  • Workshop
  • Selected Publications
  • Book Reviews
  • A Primer on Gaelic Games
  • Upcoming Events
  • Media
  • Education
  • Resources & Links
  • Data

11 Is Prime

29/10/2019

 
By Ed Valetine,

Imagine if someone got four numbers on the lotto, where you got five, but they got the bigger prize due to some sort of anomaly? It may seem unfair, even farcical. This would never happen in reality. However, sport can occasionally serve up anomalistic situations where it is more advantageous to be the runner up or loser in the long run.

Formula One has tinkered with its qualifying set up a number of times in the last 15 years in order to create a unique set of race management issues for the drivers to juggle in the search for a more entertaining product. The product was damaged somewhat with September’s Italian GP qualifying session where 8 of the 9 drivers in the top 10 shootout failed to set a lap time due to slowing down on the out lap to avoid missing the slip stream. It raised a few questions and gave rise to talk of shaking up the qualifying format in future seasons.

The FIA, Formula One’s governing body together with the commercial rights holder Liberty Media, recently discussed introducing the idea of sprint races to determine the starting grid for the main race instead of the current qualifying format where the slowest drivers do not make it into the top 10 shootout. It might make for interesting grids and more entertaining opening race stints, but could it eliminate certain anomalies that can advantage slower cars on the starting grid?

The current format comprises a first session of 18 minutes to decide places 16-20 (the five slowest cars). These five are then eliminated with the remaining 15 advancing to Q2 where the same is done for positions 11-15. The final session lasts 12 minutes and determines the top 10 starting order with the fastest winning pole position and so on.
 
It seems straight forward. It’s not.
 
Drivers who do not make the final session e.g. 11th – 20th can choose any tyres they like to start the race on while those in the top 10 must use the tyres they set their fastest lap on in that session.
 
Typically, the 11th – 20th place qualifiers will choose brand new “option” tyres for the race with those in the top 10 likely to have set their fastest laps on “prime” tyres. Prime are the fastest available tyre compound but do not last as long and are generally quicker by half a second a lap initially in clean air but this drops off a cliff quite rapidly. In a straight fight a driver on options can expect to lose .5-.75s a lap initially however this reduces and then cuts over to a dramatic gain in performance.
 
These prime tyres will have had a lap or two in “party mode” which means all of the go faster buttons have been activated to enable ultimate performance from the car. This can damage the tyre via wear and thermal degradation resulting in a 7-8% loss in performance and life - a significant amount. Occasionally, and depending on track conditions drivers in lower positions on the grid can be ahead into turn one thanks to the advantage of newer rubber off the line.

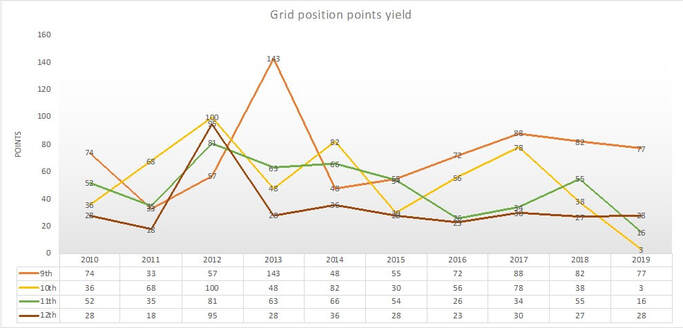
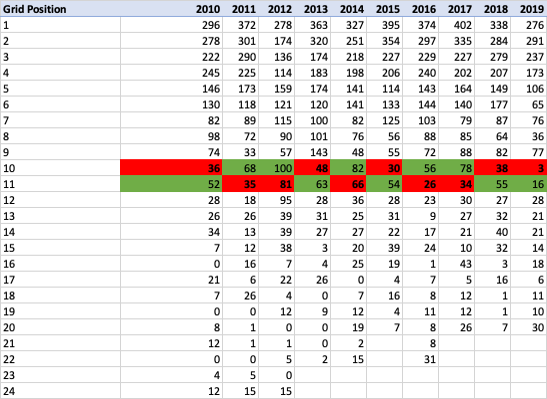
The figure and table of data aims to explain why it may be more beneficial to start from 11th place than 10th. The graphic provides points data on finishing places 9 -12. The table expands on this and show data from 1st to (in some cases) 24th position. 
Picture
Picture
Points data over the last 10 seasons has been analysed in this table, which demonstrates that in five of these 10 seasons* (*2019 season still in progress). Drivers starting from 11th position have outscored those in 10th. It is therefore more efficient to start from 11th because it means less mileage on the engine and gearbox plus reduces the risk of an accident or mechanical failure. It all amounts to lower cost and lower risk. Remarkably this season in a points sense it is 10 times better to start from last position than 10th.
 
Another contributing factor is that the 11th place grid slot is on the same side of the grid as 1st – the clean side. That’s worth a tenth or two off the line together with newer tyres. Beginning the 1st stint of the race on new tyres and track position helps to stay ahead of “faster packaged” cars as the race develops.
 
The data demonstrates that drivers at the back of the grid tend to outscore those who start in the midfield – this can be explained by the fastest cars, once or twice a season, starting from the back of the grid due to a penalty but then scoring a high points finish on race day. It also demonstrates the value of pole position though this is skewed in the current era due to Mercedes overwhelming performance advantage.
 
The scenario could be compared to finishing 2nd in a Champions League group in order to avoid playing a stronger team in the knockout rounds. Whilst it doesn’t reward out and out performance it does reward those genuinely attempting to achieve the best result overall result in the context of the wider tournament.
 
One solution to the qualifying anomaly is to have a FIFA style starting grid draw where the positions are drawn out of a hat with some seeding worked in to ensure some fairness across the field. This really would turn F1 into a lottery.
Freight Expectations

21/10/2019

 
By Ed Valentine

Of all the places to see live Major League Baseball’s New York Yankees play against The Boston Red Sox – a classic box office fixture in the annals of bat and ball history - West Ham’s London Stadium would not be the primary venue on the list. Earlier this year MLB played, for the first time, on European soil with a 4-game series following the trend set by NFL and NBA with regular season games being contested in London.

​Whilst the flight across the Atlantic may not be the norm for American sports franchises, in logistical terms pitching their tent in Europe for a weekend or two every season is not a difficult undertaking. This can be contrasted to Formula One’s global circus where 21 of the World’s finest racetracks in the most glamorous of destination cities are visited every other weekend from March to December.
 
Th F1 circus is arguably the largest global touring sport. Thousands of tons of kit are transported across the world throughout the season with occasional back to back weekend races.  It’s a tough logistical exercise but could the current calendar be arranged to make the travel easier on teams and staff?

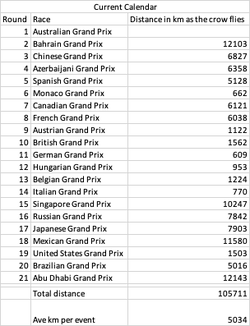
​Below is a table demonstrating the kilometers travelled from city to city under the current F1 schedule. 
Picture
The current calendar forces teams to clock up a total of 105,711 Km end to end with some tight turnarounds along the way. Take Race 2 to Race 3 - Sakhir, Bahrain to Shanghai, China. These are back to back Grand Prix which forces all of a team’s kit (fits into about 80 trucks) to be dismantled by the Sunday evening and flown to Shanghai and being fully operational by the following Thursday. Shanghai is 5 hours ahead and almost 7,000km away. Essentially the entire F1 paddock has to be dismantled and rebuilt on the other side of the world within 70 hours. The pit infrastructure and hospitality units are of the volume of 35 average family sized house moves per team. The aim of the game is not about packing up quickly but making sure it’s easy to reassemble at the other end. Every step has to be meticulously planned.
 
 
A quarter of the total annual distance is travelled by the 4th race weekend. The cash burn for these fly aways is easily $1million per week largely due to the travel. It must be a massive disincentive for new consortia who may want to enter the championship knowing that just to travel to work they’d be eight figures out of pocket. 

Picture
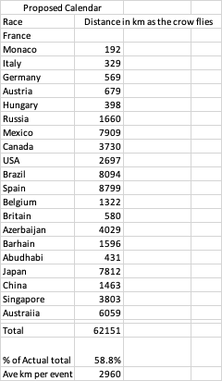
​By comparison the calendar could be arranged as per this table. The championship could begin in Europe and then move to North America. 8 rounds would be completed in the same transportation distance as the going from Melbourne to Bahrain under the current arrangement. Overall it would allow for a 40% reduction in distance travelled.
 
The limitations to this are that contractually some governments pay more to hold races at certain times of the year. Melbourne and Abu Dhabi will pay more to host the season opening and closing races than for any other slot on the calendar. In return there is the added exposure of the opening Grand Prix after a long summer break and the potential of a final race championship showdown. Monaco historically has to be in May and Silverstone marks the halfway point in the season.
 
​Formula One manages to pull this off every year without a hitch. There are lessons to be learned for global supply chains from F1’s collaborative freight management systems. I bet they even manage to keep within the Ryanair luggage allowance.

Baseline Analysis: Ranking Churn 2000 – 2017 in the ATP & WTA

29/1/2018

 
By Ed Valentine

How many economists are there in the world? Or footballers? Or lawyers (some would say too many)? How many “new entrants” are there annually across these professions and make a solid career out of it over time? Of course, there is a greater chance of an individual becoming a lawyer or accountant than a high ranking professional tennis player. World number 531 Marta Kostyuk’s run to the 3rd round at the recent Australian Open generated notoriety for it’s rarity and got me thinking if there is a “regulars only” effect in professional tennis where breakthroughs into the lucrative top 100 are uncommon. Is it more likely that the number 531 ranked player in the women’s game can make the 3rd round of a Grand Slam tournament than it is in the men’s game?
 
The analysis started with the assertion that in prize money terms about 100 male and 100 female players every 5 years (prime cycle) make a career out professional tennis. Sponsorship or endorsements have not been counted given that good players, who rank consistently highly attract these offers, where as those outside the top 100 do not command a media premium – Anna Kournikova may argue that however.
 
This analysis was conducted from data covering 18 seasons from 2000 - 2017 using year end rankings as per the ATP (male) and WTA (female) rankings. Year end rankings were chosen for consistency purposes.
 
At a basic level the data demonstrates that it is “easier” for a player to have a chance at launching a successful career in the WTA than in the ATP with 6% more female players making it into the top 100 at some point throughout the 18-year study. Whilst this represents more churn it does tell us that the opportunity to gain entry into a “career” status is greater. This is backed up by c13.5% more WTA players* making the year end top 100 just once than for those in the ATP. WTA players may not have stayed there due to the increase in competitive balance but they enjoyed the tournament privileges and chances to play in the more lucrative tournaments that come with the top 100 ranking.
Picture
19% of male players stay for 1 year and never return 20% of female players stay for 1 year and never return *14 players in the WTA and 14 in the ATP tours were new entrants in 2017 Data from ATP.com and WTA.com official rankings
​Interestingly the top 50 rankings saw the biggest gap between the WTA and ATP. This gap suggests that over the course of a career a WTA player can expect to play against more varied styles of opponent. This may be caused by the increase in Eastern European female players, enjoying brief success in the early part of their careers, only to be replaced by the very same in the years after.
 
While the odds for female players are better in terms of opportunity, almost a fifth of all of the players to have made the top 100 in both lists across the last 18 seasons appear once and have little chance of appearing there again. 

500 Million Tinkermen?

14/8/2017

0 Comments

 
By Ed Valentine

It’s hard to tire of transfer rumours at the start of a new football season. But equally it’s hard to vary it much from year to year save for guessing the number of zeros in Neymar’s new weekly wage. With deals yet to be done club managers and agents will be ensuring the office fax machines have plenty of paper while their Gmail accounts are spam free and mobile phones are fully charged to ensure that ‘crucial’ signing is completed. The transfer window as presented on Sky Sports News’ Transfer Centre can often be replete with “In & Out” graphics on the presenter’s touch screen. This binary system encasing transfer talk gets great mileage in the media but across a 38 game domestic season fans do not observe the same approach to player appearances.

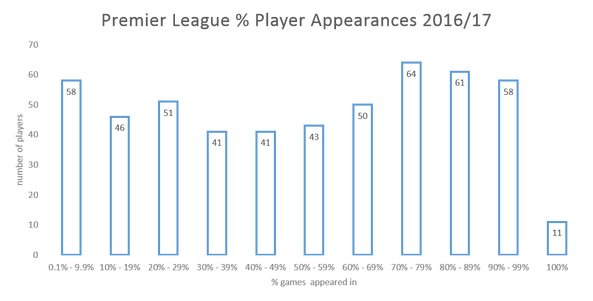
The graph demonstrates the percentage breakdowns of players who made an appearance in the 38 Premier League games in the 2016/17 season. The results are not too surprising though we do observe as many as 11 who have played in every game – 3 were goal keepers.
Picture
PicturePremier League Nationalities - Top 20


La Liga is not that different from the EPL. There is a similar trend of non-binary selection however this leans slightly more so towards an in – out philosophy than the EPL. Over the course a lengthy season with numerous cup games and internationals it’s no surprise that soccer sees blanket utilisation of squad players across the course of the season. Just six players appeared in every La Liga game last season, while 63 were seen in less than 10% of games.
 
What would be interesting to investigate is at what stage of the season do the players who are at the lower end of these bar charts rack up their appearances? Earlier would suggest they didn’t make the grade as time elapsed while late on in the campaign may represent the chance of a run out in place of an injured mainstay.
​
In some sports such as basketball, where 5 players per team are on the court at a time we’d expect to see numbers clustered at each end of the graph and practically nobody in the middle. This would demonstrate the binary mind-set where a player is either good enough to be in or he’s not. In the Premier League however, it appears that teams are largely made up of the homme moyen sensuel with Englishmen being the middlemost. This would also support the argument that managers should invest in the higher end of the average range instead of splashing out on one or two ‘big name’ signings. 

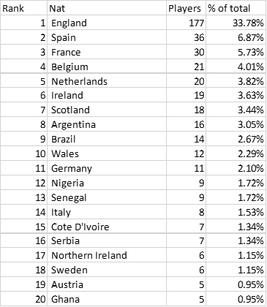
​Of the 540 players to make an appearance last season a third were English with Spanish and French talent being the 2nd and 3rd most represented. At the top 5 clubs only 14% were English. This suggests English players are largely average and are playing for largely average teams. While the Kyle Walkers of this world can command premium price tags, outfits outside the top 4 or 5 have to make do with the run of the mill players, essentially the Greggs Bakers of the Premier League player.

0 Comments

Riding High

10/2/2015

 
By Ed Valentine

Earlier this week Lance Armstrong gave a 50 minute interview where he spoke about his view on his own performance enhancing drug use during his 7 Tour De France (TDF) victories. He stated that if he had the chance to relive his career from 1995 he would still use banned substances in competition. He rationalised this by claiming that it was the culture in the sport of cycling at the time.

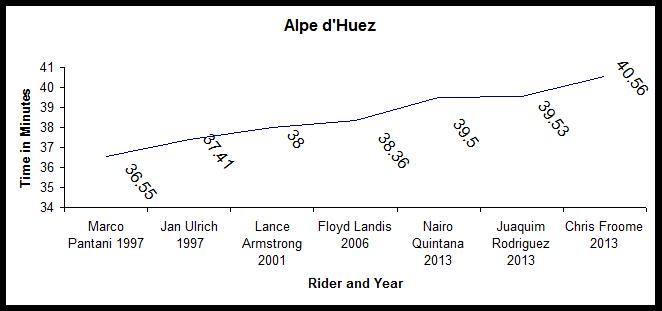
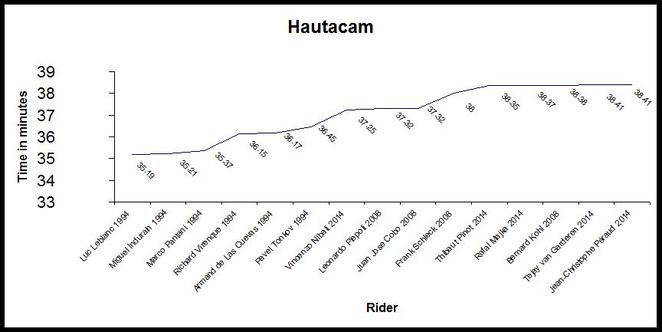
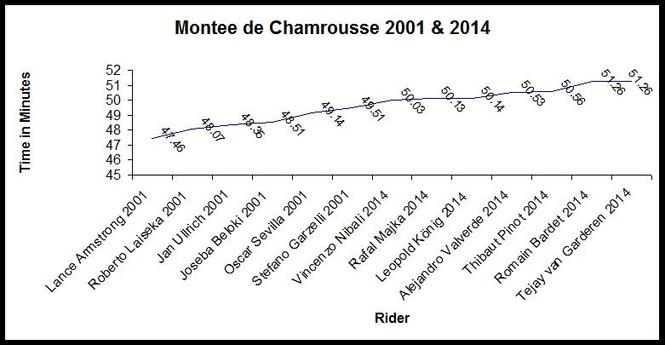
“It was an imperfect time… everyone was doing it” was his claim. Looking at the data from the tougher stages of the previous Tour de France races over the last couple of decades it can be seen quite clearly that from about 2011 times are getting slower not faster which suggests that doping is becoming less prevalent within the peloton. With better bike technology, training methods and nutrition amongst other things spectators should be seeing riders make progressive gains with streamlining and precise mechanism shaving time off year on year. Times for the big climbs on the TDF are actually radically increasing as the graphs below show.

The quickest time for Alpe d’Huez, a gruelling 13.8km climb with an 8.1% gradient, was 2 minutes 55 seconds slower in 2013 than in 1997.


Picture
The climbs of Hautacam and Montee de Chamrousse have also produced progressively slower times over the last 5 years or so.
Picture
Picture
Digging deeper by looking at the cyclists’ power to weight ratio we can see these figures have fallen off a cliff in the 2010s. In the late 1990s riders like Pantani could average out at about 6.6 watts per kilo. In 2013 and 14 the average at the front of the peloton is about 10% lower at 5.9 watts per kilo.

Armstrong said that in 2015 there would be no need for doping now but back in 1995 it was totally invasive and the culture of doping made it a level playing field like bringing knives to a gun fight.

Drug testers have stepped up their act and cycling now is much cleaner than before but it will only take a dope to change that.

Where Eagles Dare - Clean Sheets Helped To Bed In Palace

23/9/2014


By Ed Valentine

What would you say is the most memorable defensive performance in football history? The 2010 Champions League semi final second leg between José Mourinho’s Inter and Barcelona is a famous example as the Nerazzurri maintained strict defensive discipline and sacrificed possession to win 3-2 on aggregate. Or what about Jan ‘The Man Who Stopped England’ Tomaszewski of Poland who denied England a place at the 1974 World Cup with a sensational display of goal keeping? Liverpool fans may champion the reds’ defensive efforts, specifically those of Bruce Grobbelaar, for their performance during ‘that night’ against Roma in 1984.

There are countless other examples and though each is just as memorable as the next it’s likely to be a one off 90 minute display. A sustained season long demonstration of defensive strength is a different proposition entirely. Last season the stand out performers in the EPL were Crystal Palace.

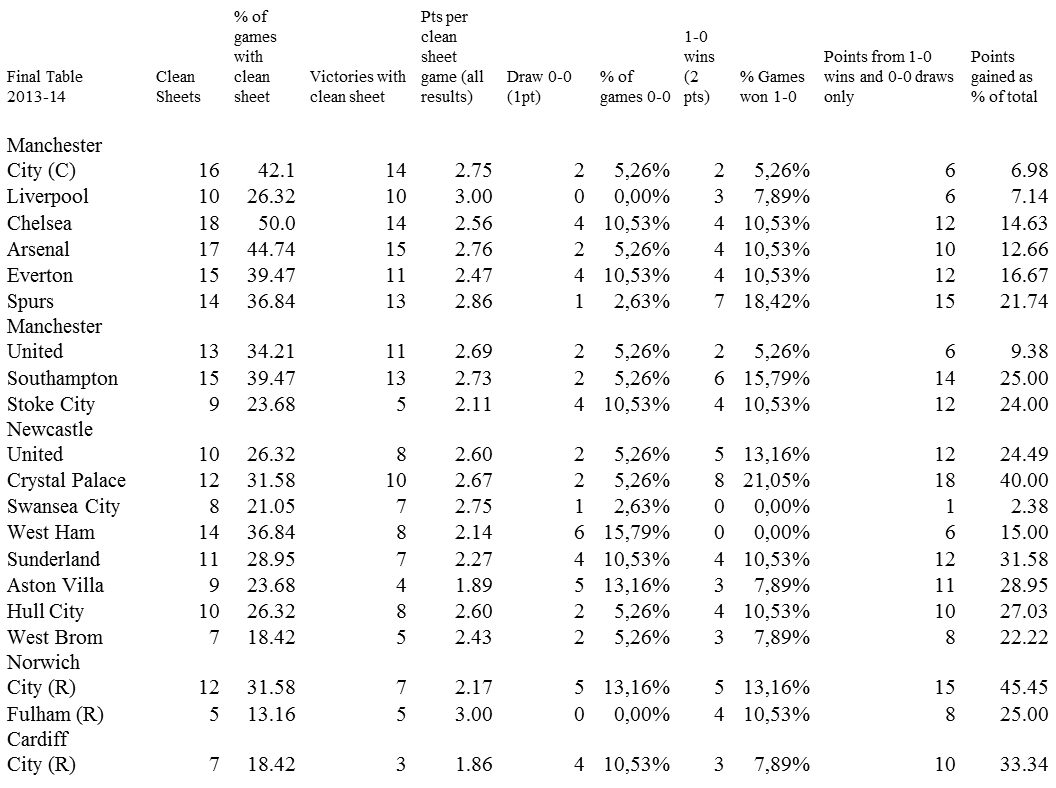
The 2013-14 campaign saw 232 clean sheets kept among the 20 Premier League sides which worked out at about .61 per game or roughly two in every three matches. What is striking is that clean sheets have a different value for each team. Liverpool won every time their opponents failed to score while Swansea’s clean sheets* were more or less redundant as they were not involved in a single 1-0 win and had just one goalless draw. This puts a time specific emphasis on when teams get points from clean sheets e.g at 1-0 being more valuable than at 4-0.

* This does not take into account other factors or dynamics that occurred in specific matches and is not a 100% reliable metric.

Picture
Palace’s ability to keep their opponents at bay during goalless draws and 1-0 leads kept them in the Premier League. No other team put together more 1-0 wins which is perhaps the stat that got them out of trouble. This was in part due to Tony Pulis employing a defensive minded 4-4-1-1 formation in a number of key matches with Mile Jedinak making 133 tackles and 139 interceptions across the season. Nobody in the Premier League made more successful tackles or interceptions during the campaign. Average blocks, clearances and interceptions per game went from 54 pre-Pulis to 64 during the Welshman’s reign while they also managed to score first in 42.1% of their games which put them firmly in the mid table. It will be interesting to see how the Eagles measure up this season under a different managerial regime.

Despite keeping 12 clean sheets Norwich found themselves in the bottom three. Relegation under these circumstances demonstrates that they did not score enough in key matches throughout the season. Although West Brom, who avoided relegation by finishing one place and three points ahead of The Canaries, kept five less clean sheets they did manage to win 1-0 at Carrow Road which further highlights the time specific importance of keeping opponents at bay – this was the result, arguably, that kept the Baggies in the Premier League.

Abu Dhabi’s billions may virtually guarantee a Premier League challenge but at the foot of the table clean sheets can help managers rest easy.

All data courtesy of Opta.

Messi Magic Outside The Box

12/7/2014

 
Picture
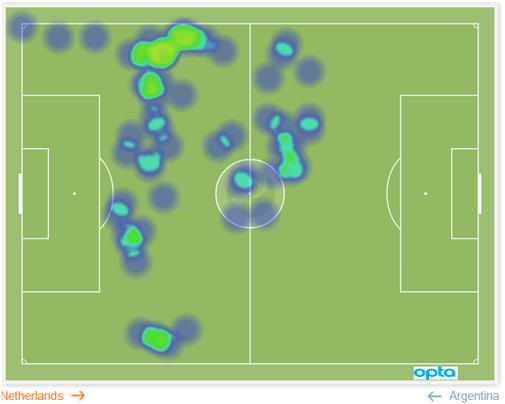
Lionel Messi heat map during the World Cup semi-final (Source: OPTA)
By Ed Valentine and Robbie Butler

With the World Cup Final little over 24 hours away, German coach Joachim Loew must be very much focused on how to stop Lionel Messi. Arguably the world’s best player for the past five years, the little Argentinian carries the hope of a nation on his shoulders in Rio De Janerio tomorrow. Stopping Messi will surely be central to a German victory and the European nation must be devising a plan to prevent the Barcelona man from exerting his usual influence over the game.
 
A closer look at Messi’s movements (when on the ball) against the Dutch in the semi-final might give the Germans food for thought. Amazingly, the Argentina captain didn’t touch the ball once in the Dutch penalty area for the entire 120 minutes of football! No doubt Manuel Neuer will hope Messi stays just as far away from the German goal during tomorrow’s final. 

The Death Of 'Samba' Soccer

5/7/2014


By Ed Valentine and Robbie Butler

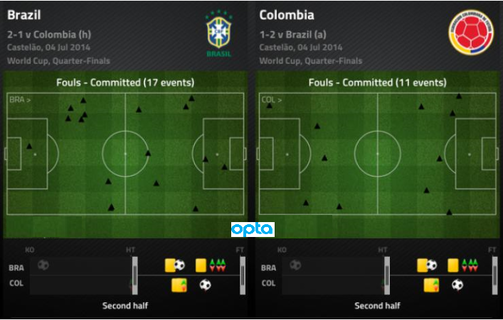
In our latest analysis of the World Cup we take a closer look at last night’s game between hosts Brazil and their South American neighbours Colombia. The game was far from a classic. In fact, some argued it was depressing to watch a World Cup Quarter Final with so many cynical fouls. Despite this, only two yellow cards were brandished by the match referee, the first of which arrived just after the hour mark, following the game’s 41st foul!

In total the game contained 54 fouls, the most of the tournament so far. In fact, the next highest is the 51-foul-game between Brazil (again) and Chile in their Second Round. Brazil committed 31 of the 54 fouls (57.4%). This is the highest number of fouls committed by a single team in any World Cup Finals match ever! The second half alone contained a massive 28 fouls. That’s about one every 90 seconds, denying either side the chance to build up any serious momentum. To give you a better idea, the OPTA figure below illustrates where the 28 second half fouls were committed by both teams. So much for the legend of Brazil and Samba Soccer.

Picture

Brazil Next On The Menu For James

4/7/2014


By Ed Valentine & Robbie Butler

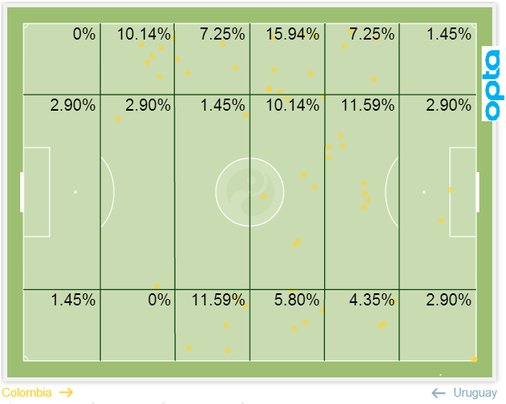
One could argue that the star of this year’s World Cup has not been Lionel Messi or Cristiano Ronaldo but Colombia’s James Rodriquez. The Monaco midfielder has scored in all four games he has played in and knocked Uruguay out of the competition on Sunday last with probably the best goal we have seen so far. 

This wonder strike was not all the young Colombian did however. In the first half Rodriguez made more passes in the attacking third than any other player. He was influential in most areas of the pitch as the graph below demonstrates.

If Brazil are to win tonight they will either have to contain James or hope he has an off-day. Based on his performances so far the latter is unlikely. Brazil’s ability to shackle the Colombian midfielder will go a long way to deciding the outcome of this quarter final.

Picture

Giorgos Karagounis Rolls Back The Years

3/7/2014

 
By Ed Valentine & Robbie Butler

Sadly for the Greeks they left the World Cup earlier this week. While many found their approach to football boring, even mechanical, their play is based on percentage football and leaves little on the table for the opposition to mop up. The Greece-Costa Rica match was never going to be fast, flowing and attractive football but it was a strong tactical display for two hours or so. The Central Americans had much more of the ball in the opening 35 minutes (61%) but the Greeks were happy for them to have so much as they sat deep and absorbed pressure. As the game went on the Greeks wore their opponents down and forced them into extra time with a last minute equaliser.

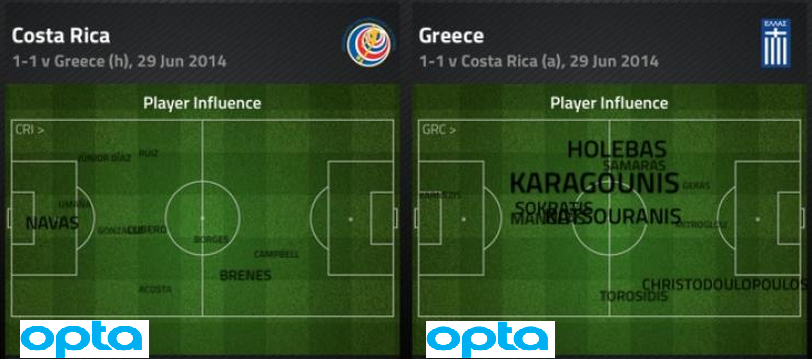
Amazingly, age is no impediment to some. The illustrations below (courtesy of OPTA) show the average position of each player and their influence during the 30 minutes of extra time. The most influential player on the pitch...one Giorgos Karagounis, at a mere 37 years of age! The oldest player on the pitch in fact. What a pro.
Picture
Average Position and Player Influence during Extra Time
<<Previous

    Archives

    March 2023
    February 2023
    January 2023
    December 2022
    November 2022
    October 2022
    September 2022
    August 2022
    July 2022
    June 2022
    May 2022
    April 2022
    March 2022
    February 2022
    January 2022
    December 2021
    November 2021
    October 2021
    September 2021
    August 2021
    July 2021
    June 2021
    May 2021
    April 2021
    March 2021
    February 2021
    January 2021
    December 2020
    November 2020
    October 2020
    September 2020
    August 2020
    July 2020
    June 2020
    May 2020
    April 2020
    March 2020
    February 2020
    January 2020
    December 2019
    November 2019
    October 2019
    September 2019
    August 2019
    June 2019
    May 2019
    April 2019
    March 2019
    February 2019
    January 2019
    December 2018
    November 2018
    October 2018
    September 2018
    August 2018
    July 2018
    June 2018
    May 2018
    April 2018
    March 2018
    February 2018
    January 2018
    December 2017
    November 2017
    October 2017
    September 2017
    August 2017
    July 2017
    June 2017
    May 2017
    April 2017
    March 2017
    February 2017
    January 2017
    December 2016
    November 2016
    October 2016
    September 2016
    August 2016
    July 2016
    June 2016
    May 2016
    April 2016
    March 2016
    February 2016
    January 2016
    December 2015
    November 2015
    October 2015
    September 2015
    August 2015
    July 2015
    June 2015
    May 2015
    April 2015
    March 2015
    February 2015
    January 2015
    December 2014
    November 2014
    October 2014
    September 2014
    August 2014
    July 2014
    June 2014
    May 2014
    April 2014
    March 2014
    February 2014
    January 2014
    December 2013
    November 2013
    October 2013
    September 2013
    August 2013
    July 2013

    About

    This website was founded in July 2013.

    RSS Feed

    Categories

    All
    American Football
    Athletics
    Baseball
    Basketball
    Behavioural Economics
    Boxing
    Broadcasting
    Competitive Balance
    Cricket
    Cycling
    Darts
    David Butler
    Declan Jordan
    Drugs
    Ed Valentine
    Epl
    Esports
    Expenditure
    F1
    Fifa World Cup
    Finances
    Funding
    Gaa
    Gaelic Games
    Gambling
    Game Theory
    Gary Burns
    Geography
    Golf
    Greyhound Racing
    Guest Posts
    Horse Racing
    Impact Studies
    John Considine
    John Eakins
    League Of Ireland
    Location
    Media
    Mls
    Mma
    Olympics
    Participation
    Paul O'Sullivan
    Premier League
    Regulation
    Research
    Robbie Butler
    Rugby
    Simpsonomics
    Snooker
    Soccer
    Spatial Analysis
    Sporting Bodies
    Stephen Brosnan
    Swimming
    Taxation
    Teaching
    Technology
    Tennis
    Transfers
    Uefa
    Ufc
    World Cup
    Wwe

Related

The website is not formally affiliated to any institution and all of the entries represent the personal views and opinions of an individual contributor. The website operates on a not-for-profit basis. For this reason we decline all advertisement opportunities. 

Contact

To contact us email sportseconomics2013@gmail.com or find us on Twitter @SportEcon.