By John Considine.
There were important competition structure changes introduced to both hurling and gaelic football in 2018. Both sporting codes saw a round-robin element introduced. The hurling competition changed to a structure that much of the sporting world recognises. The first stage of the competition is now round-robin and the second stage of the competition is knockout. It is not dissimilar to the competition structure in the major US sports where there is a regular and post-season part. The new gaelic football format has a round-robin element sandwiched between two knockout stages.
Many team sporting competitions end with a knock-out component. The round-robin gives fixity-of-fixtures and the knockout element helps build excitement for the fans.
The purpose of this post is to quantify the implication for spectators numbers, i.e. those passing through the turnstiles (TV audiences are another matter). What follows are the numbers for the Munster senior hurling competition. A similar analysis can be performed for the Leinster competition.
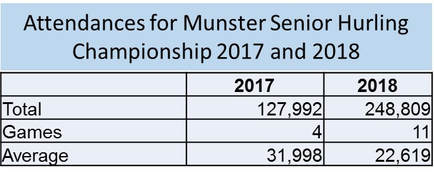
The 2018 change to the competition structure of the Munster Senior Hurling Championship had the expected impact on attendances. By moving to a round-robin structure the number of games increased and so too did the total attendance. The 2017 competition had 4 games, namely, a quarter-final, two semi-finals, and a final. A total of 127,992 spectators passed through the turnstiles. The 2018 competition had 11 games. There were 10 round-robin games and a final. There were 248,809 spectators for these 11 games. The average number of spectators per game declined while the overall numbers increased.
Many team sporting competitions end with a knock-out component. The round-robin gives fixity-of-fixtures and the knockout element helps build excitement for the fans.
The purpose of this post is to quantify the implication for spectators numbers, i.e. those passing through the turnstiles (TV audiences are another matter). What follows are the numbers for the Munster senior hurling competition. A similar analysis can be performed for the Leinster competition.
The 2018 change to the competition structure of the Munster Senior Hurling Championship had the expected impact on attendances. By moving to a round-robin structure the number of games increased and so too did the total attendance. The 2017 competition had 4 games, namely, a quarter-final, two semi-finals, and a final. A total of 127,992 spectators passed through the turnstiles. The 2018 competition had 11 games. There were 10 round-robin games and a final. There were 248,809 spectators for these 11 games. The average number of spectators per game declined while the overall numbers increased.
It is not possible to say much more because the 11 games in the 2018 were played at four different venues with varying capacity constraints. For example, the game between Limerick and Clare was played in Ennis with the capacity limited to under 19,000. It is probably that over 30,000 would have attended if the stadium could have accommodated them. Similarly, the Waterford game against Tipperary might have attracted closer to 20,000 if there was a stadium in Waterford with that capacity. By contrast, all four of the games in the 2017 championship were played in Thurles.
The change "worked" in Munster because the county teams are close to each other on the field and geographically. The experiment is likely to survive. The evidence is less clear cut for the new football round-robin.
The change "worked" in Munster because the county teams are close to each other on the field and geographically. The experiment is likely to survive. The evidence is less clear cut for the new football round-robin.
 RSS Feed