The Economics of Sport
  • Sports Economics
  • About
  • Workshop
  • Selected Publications
  • Book Reviews
  • A Primer on Gaelic Games
  • Upcoming Events
  • Media
  • Education
  • Resources & Links
  • Data

Long-run Competitive Balance and the League of Ireland

27/1/2016

 
By Farai Jena & Barry Reilly
 
In a recently published book (Money and Football: A Soccernomics Guide) Stefan Szymanski examines, inter alia, the concept of club dominance in European football leagues over the last 50 years. Szymanski reports, using data from 20 European leagues, that an average of only 10 different clubs have won their domestic league titles over this half century, ‘….way below what you would expect to see if there were balance in the league’. The League of Ireland, providing 15 different champions over this period, is identified by Szymanski as one where the number of different winners is considerably above the average.  This could be taken to suggest that it is one of the better balanced leagues in Europe.

There are a number of alternative methods available to determine a league’s long-run competitive balance. One such measure is known as the Herfindahl Index of Competitive Balance (HICB). In an extreme hypothetical case where all teams complete the season with the same number of points (i.e., a perfectly balanced league), the HICB value is one.  In contrast, the greater the inequity in the distribution of points across teams at the end of the season, the higher above unity is the HICB and the poorer is the league’s competitive balance.

In order to explore the issue of competitive balance for the League of Ireland we use the HICB to compare its degree of balance with a set of neighbouring leagues in England, Scotland, Wales and Northern Ireland over 16 recent seasons. The leagues are selected on the basis of arguably possessing comparable playing standards to the League of Ireland. 
​
Figure 1 plots the HICB for the League of Ireland Premier Division, the average of tiers three to five in England, and the average of tiers two and three in Scotland. The averages are used here because little material difference in index values is detected across these leagues over the relevant seasons. In contrast to the leagues in England and Scotland, competitive balance is found to be markedly inferior in the League of Ireland. In addition, the league’s index also exhibits a greater degree of volatility over time particularly with respect to its English counterparts. 
Picture
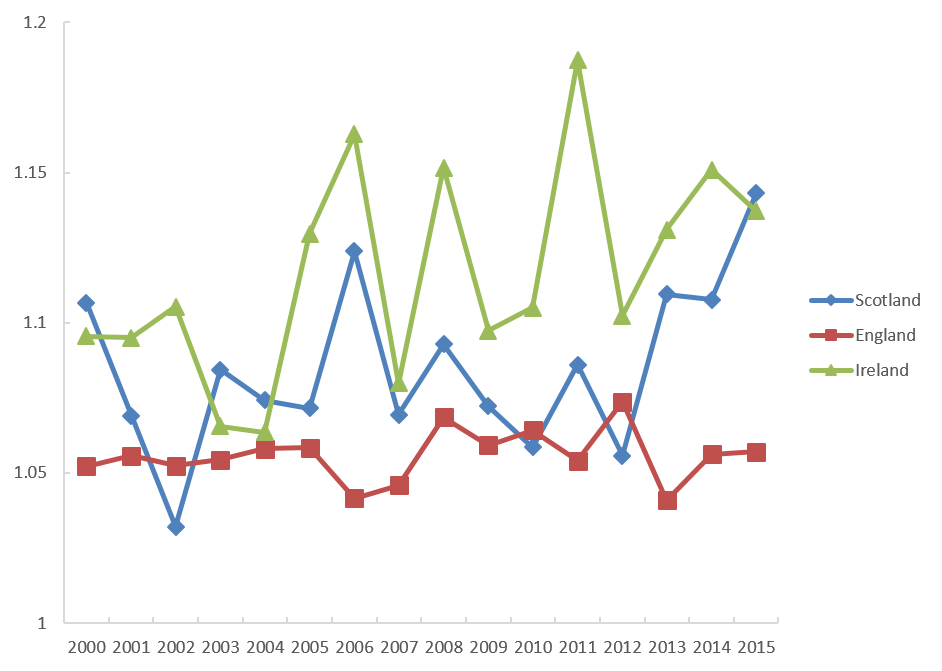
Notes to Figure 1: The HICB values for England are an average of the third, fourth and fifth tiers of English Football. The HICB values for Scotland are an average of the second and third tiers of Scottish Football. Given the introduction of summer soccer in Ireland in 2003, the years reported on the horizontal axis relate either to the second year of a conventional playing season played across two calendar years or a summer soccer season played within one calendar year.
Figure 2 plots the League of Ireland’s HICB with those for the top tiers in Wales and Northern Ireland. These two close neighbours register a fairly high degree of competitive imbalance in common with the League of Ireland, though the index for the latter is characterised by a greater degree of volatility compared to the former two. 
Picture
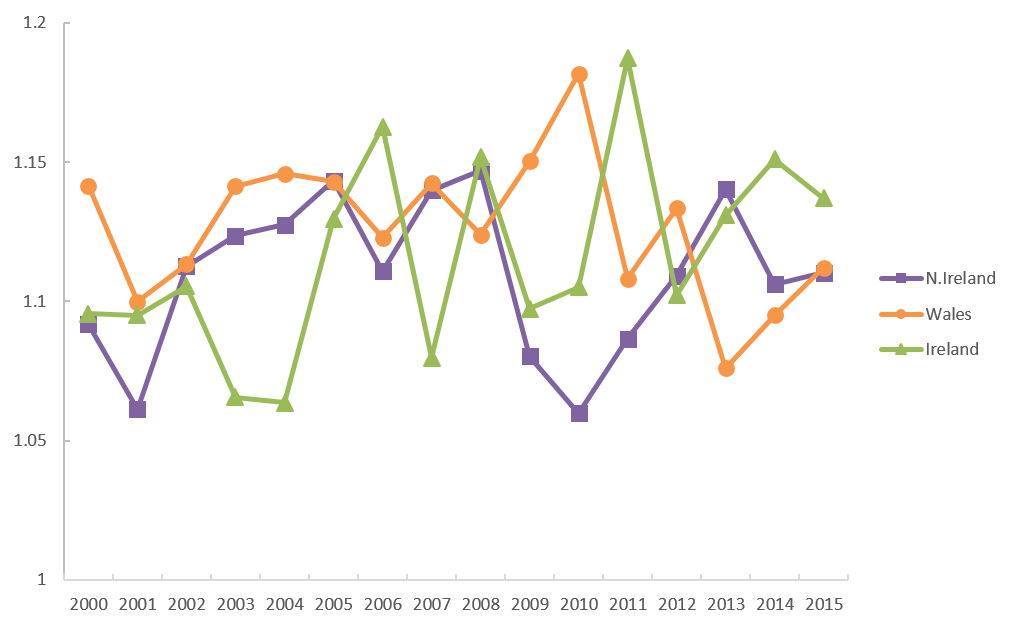
Notes to Figure 2: Given the introduction of summer soccer in Ireland in 2003, the years reported on the horizontal axis relate either to the second year of a conventional playing season played across two calendar years or a summer soccer season played within one calendar year.
Further, and not reported here in detail, the top tier leagues described by Syzmanski as the most plutocratic (viz., England, Germany, Spain and Italy) all register lower average HICB values than the League of Ireland over these 16 seasons, though the most dominated league in Europe (i.e., Scotland’s top tier) averages slightly higher.    
​
A reason why a league’s long-run competitive balance might actually matter is because of its potential relationship with attendance.  A poorly balanced league is likely to prove unattractive to spectators.  Figure 3 plots average attendance and the HICB values (both standardized) for the League of Ireland over these 16 seasons in order to discern any informative patterns. The plots reveal an inverse relationship between competitive imbalance and average attendance. The correlation coefficient is computed at –0.60 and is statistically significant at the 5% level using a t-test with 14 degrees of feedom. It should be emphasized that this finding is best interpreted as suggestive since nothing informing the causal relationship between these two variables can be inferred from this statistic.  However, competitive imbalance and attendance appear to move inversely in this league.
Picture
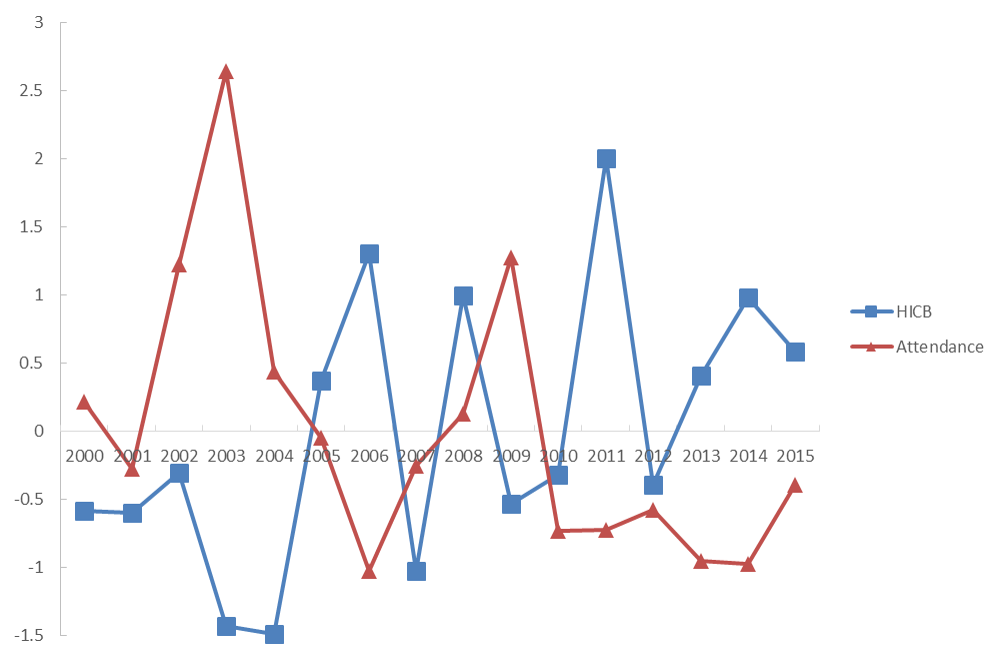
Notes to Figure 3: The HICB and attendance variables are standardized by subtracting the relevant mean and dividing by the relevant standard deviation to ensure both variables are expressed in comparable units of measurement for plotting purposes.
The domination of a league over time by a small number of teams may suggest long-run competitive imbalance but it does not imply that less dominated leagues by this defintion are competitively balanced.  The descriptive evidence reported here covering 16 recent seasons, and over which time seven different teams won the League of Ireland title (suggesting even weaker dominance than that reported by Syzmanski’s analysis), reveals the domestic league is competitively imbalanced when compared to either neighbouring lower tier leagues in England and Scotland or even Syzmanski’s set of plutocratic European leagues.  The very casual empirical evidence provided here also suggests that the lack of competitive balance within the League of Ireland might actually matter for attendance. 
 
Farai Jena is a Teaching Fellow in the Department of Economics at the University of Sussex.  Her research interests are in the area of applied microeconomics and include the economics of migration, migrant remittance behaviour, and the demand for football. 

Barry Reilly is Professor of Econometrics in the Department of Economics at the University of Sussex. His research interest include labour economics and the economics of sports.  He has published research on developing country labour markets and on racial discrimination in football.  

Sports Capital Payments to Wexford 2009 – 2014

23/1/2016

 
by Kathy Stout

In previous posts John Considine has extensively examined the allocation of the Irish Sports Capital Grant (here, here, here, here and here). This post examines the allocation, between 2009 and 2014, for one such county; Wexford.

Wexford’s sports capital payments are an example of a matching grant which is where the relevant governmental department matches funds contributed by the applicant. In this scenario of 100% of the funding, the state pays for 70%, the other 30% by the sporting institution. Wexford did not engage in any major development projects so is below the average level of payments per county from 2009 to 2014. One of the main observations found is despite the GAA receiving the highest number of payments, football associations were allocated the highest amount of funding per sport due to their ability to give more to the matching grant scheme from the profits they make.

Table 1 below provides information on the annual grant provided to the county and the annual percentage change in allocation. The striking drop in funding is explained in part by its correspondence with the Irish fiscal crisis,as the economy had contracted from $273.7bn in 2008 to $233.5bn in 2009 with a further drop to $218.4bn in 2011.
Picture
Another explanation for this initial drop is the restriction on grant applications in 2008. After this year applications for grants by sporting institutions were not accepted, however payments were still being made for the following years based on previous applications. In Wexford’s case the majority of these had been paid in 2009, accounting for the considerable decrease in 2010. 

​Whilst the average payment size does see a drop from 2009 to 2010, there is substantial variation over the following years showing that it is the number of payments made, and not the average payment size, which makes the most impact on the overall yearly amounts paid out. The average payment in 2012 is €41,736, relatively speaking not far from the 2009 figure of €48,554.26 however the difference of eleven payments in 2012 versus thirty-eight in 2009 explain the difference in total funding. It is apparent from the data that GAA and football clubs receive the largest grants (for the most part), due to their ability to contribute more money to the grant to be matched, and sports with lower levels of engagement (and profitability in general) such as rowing, gymnastics, swimming, and athletics receive the smallest sized grants. Figure 1 below illustrates the dominance of GAA and football in terms of the number of grants awards. 
Picture
Picture
As you might expect, the greater number of grants directed towards GAA and football translates into greater payments to these sports (Figure 2). The GAA received 38% of the number of payments approved and 36% of the total monetary funds paid out. In comparison, football payments accounted for 25% of the number of payments allocated but gained 34% of the total monetary value. This indicates that while there were less football grants, on average they were of a larger value.

What is also evident is football clubs were in the position to contribute more to the grant scheme in this time showing that within Wexford, this is the most profitable sport.

Kathy Stout is a final year Bachelor of Arts student. She is a recipient of a University College Cork Quercus Academic Scholarships and is currently Auditor of the UCC Economics Society.

Supporter-Owned Clubs Proving their Worth

20/7/2014

 
By John Paul Clifford
Picture
There is a growing problem in football in many countries, which has also affected Irish football significantly in recent years, of clubs living beyond their means and going under due to the weight of excessive debt. This becomes a real problem for fans losing the team they adore, along with jobs lost, unpaid debt to local businesses and a void being formed which once brought people together in a positive manner. The massive rise in transfer fees and wages across the continent at the top levels has not improved the overall game. Those with the massive television deals may benefit but the rest are left to fight among themselves for any smaller deals that may come their way.

In fact, a recent European Commission report focusing on the professional sport transfer market proves that the above is indeed correct. This has led to a massive gap between the highest tiers across Europe and anything outside the top divisions, making it increasingly harder for other clubs to compete. Sean Kelly MEP spoke on behalf of European Parliament’s committee on Culture and Education which includes sport, saying that ‘’The figures are striking, €3 billion is spent every year on transfers in professional football in Europe, with only approximately 3% of that or €60 million filtering down towards the smaller and amateur clubs for the development of the sport and talent for the future.

The proposal being floated is to have a 'fair play levy' on these exorbitant transfer fees would help smaller clubs and grassroots threefold: compensating them for the costs of training and educating young players, funding development of sport at community and grassroot level, as well as helping clubs to compete on a more level playing field’’. 

The above figures show that finances are not filtering down through to the lower levels and grassroots clubs in the game, who often provide the initial starting point and footballing education for the future‘superstars’ of the game who later end up with the big clubs.

This brings in a fundamental question though, if 97% of the transfer fees don’t ‘trickle down’, where does it go? Well, a lot of the top clubs across Europe have to serve many masters such as investors, owner’s profits, operating costs, debts, high wages, dividends, and focus on the stock market. A lot of this money within the top clubs may be repatriated to areas outside with which the clubs themselves actually operate in, which leads to less money within the local economies, less spin offs, lower growth (if any) and lower social benefits to the local communities. Some clubs even have their company's incorporated outside of the locality they represent as a club for tax reasons. Some are incorporated in the Cayman Islands. This reduces taxes and forces money which could have been reinvested or kept within the locality of the club, further increasing the 'value added' aspect to the economic impact the club has in the local region. 

This is why fan ownership can offer a fantastic alternative. Less financial risk is likely to be taken, as fans on the clubs board of management are unlikely to personally guarantee financial risk in a club they love. The fans and board often hold many skills from their personal and professional lives which can be of great benefit to their club. This can actually save clubs money in the long run as they don’t have to seek it externally. Fans generally pay a subscription to become a shareholder or member of the club. This generates a nest egg for the club providing security for any unforeseen situations that may lay ahead. That pot of money can also be used to improve the club, reduce debts or for social projects which can help both the club and local community. Fans are unlikely to be focused on dividends, returns, benefits, expenses, and massive profits. This means that the money is generated within the club, is more likely to remain within the club. Any profits are very likely to be reinvested in the club and/or local community. This creates both economic and social benefits to local community.

Picture
Clubs that have their fans at the heart of their ownership structure allows for instant feedback on all issues which the club can take on board and address more readily, rather than clubs which are privately owned and may have to commission studies, reports and interviews to get a feeling of how the people (fans) outside of the clubs ownership feel about fundamental issues. It is only logical for fans to have a large input in to the running of the club. After all, these clubs are a business, any good business must look at its market and how the market feels about issues. By bringing the market in to an internal aspect of the club, this creates goodwill, loyalty, accountability and long term financial backing (in the form of membership fees) which the club can rely on. That creates a financial safety net or ‘rainy day’ fund for any future situations. This is in contrast to financial backing from privately owned groups who are likely to pull the plug on their investment as soon as it becomes unlikely that a return will be made. In fact, director’s loans may be placed on the club, pushing it in to further debt until the investor’s returns are met. This can financially strain future owners of the club, who may be the fans, as they are likely to be uninterested in paying the previous owners for their work on top of purchasing the club. However, if they are not met, this can force the club in to insolvency and possible extinction. The fan ownership model creates a sustainable, long term strategically planned club with a constant fundraising mechanism in place, in the form of membership subscriptions.

In recent years in the League of Ireland (Airtricity League), many clubs have faced several financial situations. Some have unfortunately met their demise, whilst others have become supporters owned clubs. Cork City, Sligo Rovers, Shamrock Rovers and Dundalk are just a few who have supporters groups at the heart of the decision making with respect to the running of the club. In times before some clubs had become supporter owned, massive unsustainable losses was surrounding the league as a whole. This sadly led to the demise of some clubs including Sporting Fingal, Monaghan United and Kildare County. Some other clubs had to rejoin the league years later or reform under new ownership, such as Cork City and Derry City. In 2007, the collective losses of the league was €6.9 million. In 2012, the league recorded a collective profit of €241,000. Some of this can be distorted by prize money received by Shamrock Rovers from their very successful 2011 Europa League run, but it remains to be seen if it was included in the 2011 or 2012 accounts. Either way, the problem has stabilised for the league as a whole. Clubs run by fans are being run far more prudently. There have been no massive financial losses recorded either, the most being €40,000. As more clubs have become supporter owned, they have become far more prudent, only spending what they take in, being conservative with estimates. This shows why the problem has reduced and hopefully with more supporter involvement, we can see the league record yearly collective profits on a consistent basis. 

As the huge losses that once gripped the League of Ireland have been eroded, this allows money generated by clubs to be spent in other forms, rather than servicing debt. Stadium facilities, training grounds, under age teams and community projects can be considered and invested in by the clubs and supporters, the possibilities are endless, with less debt and supporter ownership, fans have the power to make real, sustainable and positive change for their clubs. The feeling that a supporter can have even the smallest say in the running and direction of a club is hugely encouraging, rewarding and also keeps them a supporter for life, leading to a sustainable market and model. The days of relying on outside investment based on unsustainable spending and lack of sound structures within clubs appear to be gone. Clubs have focused on prudent financial planning and developing structures, links with the community and underage teams, leading to more youths getting senior experience, has resulted in a more financially sound league with more supporter involvement in the decision making process at many of those clubs. This appears to be the way forward and for now, for the first time in a very long while, clubs and supporters are rowing in the right direction together, leading to healthier clubs and a healthier league. The supporter ownership model is leading the way.

This article is based on one that originally appeared in the European Commission supported ‘Heart of the Game’ document, which was created by the FORAS Trust.

A Wire-to-Wire Winner in the British Open?

16/7/2014

 
By Aidan Moynihan
Picture
The second of golf’s four annual majors, the U.S. Open was this year played at Pinehurst in North Carolina, U.S.A. from June 12 – June 15. The competition produced a “wire-to-wire” winner whereby Martin Kaymer led at the  completion of all four rounds. Kaymer scored rounds of 65–65–72–69 to win. The following week in the Irish Open, Mikko Ilonen produced the same feet in recording another wire-to-wire success. What are the chances of another such win at the forthcoming British Open Championship?
 
The Open Championship, or the British Open as it is also known by, will be played at Royal Liverpool (Hoylake), from July 17 – July 20. The third of golf’s annual major’s is played on alternating venues each year and this will be the first event at Royal Liverpool since 2006, where Tiger Woods successfully defended the Claret Jug. On this occasion Woods lead the field after the completion of rounds 2 and 3. He was in second place at the completion of round 1. 
 
In the past 20 years there has been only 1 wire-to-wire winner of the event. That was Tiger Woods in 2005 at St. Andrews. Woods recorded rounds of 66-67-71-70 to win by 5 shots over his nearest competitor. In 1995, also at St. Andrews, John Daly had a share of the lead at the completion of both rounds 1 and 2, before dropping to 4th place in round 3 and eventually winning in a playoff.

When analysing the past 20 years of Open data it can be seen that while wire-to-wire successes are uncommon, the eventual winner does tend to well placed on the leader board at the end of round 1. In-fact, 10 of the past 20 winners were placed fifth or better after round 1, 14 of the last 20 winners were all placed inside of the top 10 after round 1. 

Picture
In 1999 at Carnoustie, Paul Lawrie was in 4th position after round 1. However, he entered the final round in 14th position before overcoming a British Open record 10 shot deficit after 54 holes, to win in a playoff. The event is best remembered for the actions of Jean Van De Velde more than those of Lawrie. 

The worst placed winner at the completion of round 1 was Mark O’Meara at Birkdale in 1998. O’Meara was in 62nd  position after round 1 but his good second round moved him into 6th position after 2 rounds. Similar scenarios occurred with Todd Hamilton at Royal Troon in 2004 and Padraig Harrington in 2008 at Royal Birkdale. Hamilton was in 40th position after round 1 but his second round saw him move into 5th position after 2 rounds. Harrington meanwhile, was in 38th position after round 1, before moving into 4th position after round 2 along the way to  successfully defending the championship.

When looking at the position of the winner after the second round the trend becomes even clearer. Eight of the last 20 winners were actually leading the British Open after 2 rounds. Thirteen out of 20 were placed fifth or better while 16 out of 20 were inside of the top 10 after 2 rounds. David Duval at Royal Lytham and St. Anne’s, in 2001, was in 35th position and so represents the greatest comeback of the past 20 winners.
Picture
While not impossible, the talent in the field makes it unlikely that we will have a wire-to-wire winner in the forthcoming Open Championship. An analysis of the last twenty years suggests that the winner will be well placed at the end of round 1. If not, they will be after round 2. Perhaps it would be wise to wait until Friday evening before attempting to predict the winner.

Earning More At Half-Time

3/7/2014

 
Picture
By Pádraig MacConsaidín

With the FIFA World Cup in Brazil well underway, over recent weeks television advertisements have been commandeered by various players endorsing a product or service. Using soccer luminaries, or more accurately, their image, to promote products is big business, especially during major tournaments; such as the FIFA World Cup and UEFA European Championships. For those of us of a certain vintage, we can still remember Kevin Moran extolling the virtues of using the Irish Permanent’s ‘bureau de change’ service, to convert Irish Punts into Italian Lira before leaving home to follow the boys in green around Italy in 1990.The Adidas and Nike adverts in the run up to the big tournaments always stimulate interest as to who will devise the more exciting, captivating and adventurous advertisement; featuring the galaxy of stars signed to each company’s respective marketing stable. This practice has become more pervasive over the last twenty years, which begs the question; what do you give the global soccer superstar who has vast amounts of money in return for using his image? The answer, unsurprisingly enough, is in fact, more money. 

To understand the phenomenon a little better, perhaps we should reflect briefly on the history of image rights in football. From the early to mid-1990s, sponsorship deals in English football were moving into multi-million pound territory.

Picture
The arrival or BSkyB as a corporate entity, which secured the rights to broadcast live Premiership football, beating off competition from the BBC and ITV, provided significant revenue streams for clubs in the top flight of English football. This allowed players to command higher salaries, while off the field, they were also beginning to realise their star potential through endorsements, as the Premiership footballer began to achieve global exposure through the broadcasting of the league across continents. The days where football’s greats like Best, Charlton and Brady bought their own boots were gone. Players were now rewarded for endorsing a specific brand, where brand loyalty and exclusivity brought; financial remuneration, further commercial exposure and an endless supply of boots; customised with the player’s name, those of his children, or both.

This newly acquired stardom and earning potential did not go unnoticed amongst the non-English based players either. In the 1992/1993 season, in the opening round of matches, only eleven players named in all clubs starting line-ups were classified as ‘foreign’ (non-UK or IRE). This increased to 36 per cent of all players for the 2000/2001 season and increased again to 45 per cent for the 2004/2005 season. Historically, Arsenal was the first club to name an entire sixteen man squad of ‘foreign’ players for a game in February 2005. The Premier League was an attractive proposition for any overseas footballer, especially those who possessed a star quality, with the lure of the financial rewards and increasingly prevalent commercial opportunities the league presented. As a new wave of non-British player arrived to the Premier League, so too did the business savvy players’ agent and shrewd financial advisor.

In the early days of the Premier League, paying players was a relatively straight forward exercise. The player was paid a salary, on which he could expect to pay approximately 50 per cent income tax. As the advisors and agents became more involved in the negotiations, the remuneration package was essentially divided into two components; first the salary and second, a fee to allow the club to use the player’s image. The salary was, as before, directly taxable by Her Majesty’s Revenue Commissioners, however, the payment of the fee for the ‘image rights’ was more complex. This could be paid into an off shore company and thus avoid the high rate of income tax. Instead, this amount would be assessable under a corporate tax structure, which was often half the rate of income tax for high earners. The case which stands out in this regard is that of Dennis Bergkamp. The Arsenal player was paid in total, £3.5 million a year by the club, £2 million in salary and £1.5 million by way of ‘image rights’. The ratio of pay to image rights raised eyebrows in the headquarters of the Inland Revenue who challenged the arrangement on grounds of tax avoidance, but in the end, following an investigation by a special commission, Bergkamp won out. The commission deemed the structuring of the ‘image rights’ payment, a legitimate commercial contract. A precedent was set. However, the Bergkamp deal was small change in the overall scheme of things for what was to come in terms of players cashing in on their ‘image rights’, both in terms of contracts and off the field endorsements. This will be discussed in a further post on this blog.

The ABCs of Funding by Gender in Ireland

17/5/2014

 
By Eoin Whyte
Picture
The ‘Rooney rule’ was adopted in 2003 and established a set of guidelines for all NFL teams in their selection process for head coaching and senior football operation jobs. Under the new rules all NFL teams are now required to interview people considered to be of an ethnic minority when making an appointment for any of the sport’s top coaching positions. The rule has made a significant impact on the number of African American head coaches in the NFL. In 2002, the year prior to the adoption of the Rooney rule, there were only 2 African American head coaches employed in the NFL. Four years later this number had increased to 7. 

Madden and Ruther (2011) argues that this increase illustrates that there had been discriminatory influences in the previous selection process of new coaches in the NFL. According to Madden & Ruther, discrimination occurs “when the marginal or last African American coach hired must be better than the marginal white coach”. Table 1 below, from Madden & Ruther (2011), details how, prior to introduction of the Rooney Rule, there was a significant discrepancy in the number of African American coaches to white coaches in the NFL. The table also highlights how, prior to the rule, African American coaches enjoyed a significantly higher win rate averaging 9.1 wins a season versus 8.0 of their white counterparts. Sixty-nine percent of African American coaches got their respective teams to the play offs versus thirty-nine percent of all other coaches. Since the Rooney rule however, these discrepancies has evened out and the win rate of African American coaches has decreased.

Picture
The Madden & Ruther paper comes to mind when examining the Irish data for International Carding Scheme funding between 2008 and 2014.  It is interesting to note that there are  discrepancies in the funding between males and females in Athletics, Boxing, Cycling and Swimming, what I label the ABC’s of Irish sports.

The first chart below highlights that more male athletes have received funding than their female counterparts in all of their respective sports under ICS funding between the  discussed years. 65 males were funded in Irish athletics versus 64 female athletes. 79 male boxers were funded versus the mere 3 female recipients. 42 male cyclists were funded as opposed to the 10 female counterparts. And 36 male swimmers were granted funding in comparison to 27 female swimmers.

Picture
However on average, female athletes have been granted more funding than their male counterparts. The second chart illustrates how female boxers on average received over 3 times more funding than male boxers. In athletics, on average females enjoy 16% more funding than male athletes. Cycling has a 21% difference in the average funding for male and female athletes in favour of female athletes. While the average funded female swimmer also earns 53% more than the average male swimmer.
Picture
Of course is it is easy to recognise these figures being possibly distorted by the success of Irish female athletes such as Taylor (Boxing), Murphy (Swimming), O'Rourke and Loughnane (Athletics), all of whom are amongst the higher funded recipients.

However, these differences still pose some questions.  Akin to the African American coaches’ previous higher success rate in the NFL, do Irish female athletes receive more funding versus their male counterparts only because they have to be exceptional in their respective sport to receive funding in the first place?  Or, are females athletes funded to a higher level in an attempt to encourage more females into sport?  It is hard to say. It requires further investigation.

Too hot to lose

5/5/2014

 
by Sean O'Connor
Picture
With the World Cup drawing ever closer, much of the build up to Brazil has been dominated by how teams will cope with the intense heat. This has become such an issue that FIFA have sanctioned water breaks throughout games in order to allow players some relief from the anticipated searing heat. A paper written by Maughan et al. (2010), titled “Living training and playing in the heat: challenges to the football player and strategies for coping with environmental extremes.” noted how football played in high temperatures can not only effect player performance but prior acclimatization can also lessen the impact.

However, this raises the question, what effect can temperatures have on a nation’s chances of lifting the World Cup? Do countries of warmer climates produce more winners? In a previous post on this blog, David Butler considered the relationship between geography and World Cup success. An important aspect that makes geography important is the climate.

The higher the temperature the more difficult even the simplest of tasks can become for even the most gifted players. So surely those who are used to a warmer climate should cope more favourably in these conditions than those who are not? Using average annual temperature data, I’ll attempt to address whether on average warmer countries produce more World Cup winners than colder ones.


Picture
Picture
As the data shows, on average nations who experience a warmer climate tend to adapt much better to playing in colder conditions than colder nations adapting to warmer ones. Of the nineteen World Cups played, only on four occasions has a country of a colder climate come to a warmer one and tasted glory (1950: Uruguay, 1982: Italy, 1990: West Germany, 2010: Spain). Even these differences, in playing in a hotter climate are minimal and for the last World Cup, the all European clash between Spain and Holland took place in South Africa’s winter period (June and July temp circa 11ºC).

Of course if only climate mattered, we could expect World Cup winners from among the Middle Eastern and African nations given their high temperatures. Obviously talent still plays a key role, given that the strongest teams still stand the best chance of making finals. However, it appears that strong nations with warm climates tend to stand a much better chance of success in Brazil e.g. Brazil, Argentina, Colombia, Uruguay than their cooler counterparts, Germany, Spain, Italy etc. 

The Finances of Football Associations in Britain and Ireland

17/4/2014

 
by Sean O'Connor
Picture
Information on and interest in football clubs’ finances have grown considerably over the years, to the point whole financial reports have been published on them. One of the most well known and anticipated is the “Deloitte Football Money League”. This yearly report, now in its 17th edition provides a detailed analysis of clubs’ financial performance over the course of a season.

However, while financial information on clubs is generally easy to access, information on national associations’ performance generally goes undocumented, at least in a comparable sense.  Fortunately a large level of information on national associations’ financial performance is readily available and with this in mind I’m going to examine a number of financial measures for the football associations of England, Wales, Scotland, Northern Ireland and the Republic of Ireland from 2003-2012

Turnover or revenue highlights monies received by each association from ticket sales, sponsorship deals, television rights, qualification for tournaments etc.  Although all associations are generating a greater level of turnover in 2012 than that recorded in 2003 (or 2006 for Northern Ireland), none can match the capabilities of England. This is no surprise when you factor in the revenue streams that the FA has to call upon in comparison with the other associations. Qualification for major championships, multi-million pound sponsorship deals with Budweiser, Vauxhall as well as the TV rights to the FA Cup mean England are a juggernaut with regards to revenue generation. Surprising is Ireland’s impressive performance on turnover throughout the period. A doubling of revenue in the FAI from 2003 to 2012 is a significant achievement given the interim period didn’t see the nation qualify for a major tournament (they did qualify for the European Championships in  2012), which usually brings with it increased sponsorship revenue.

Picture
Retained Profit refers to the profit left to an association once all costs and taxes have been accounted for. During the period examined the FAI was the association making the largest loss (in 2008). A number of factors were noted for this loss, operating losses being the greatest of them. (Click here for summary). FAI profits have dropped dramatically from highs of over €4m in 2007. Of all the associations the Welsh FA was the only organisation to record a loss for 2012. Throughout the entire period the SFA recorded profits in every year with 2006 being the most impressive. 
Picture
Examining wages and salaries from a per worker basis, no association is paying staff on average more than what they did at the start of the period under review. If we take the change in wages since 2007, as this year provides comparable data for all 5 associations, FAI salaries per worker fell by -7.5%, Welsh FA by -3.7% England FA by -30.9% and IFA by -20.3%. During this period only the SFA per worker salaries increased, by 8.6%. Only the FAI has decreased staff numbers, with all other associations employing more staff now than they did in 2008. 
Picture
Table 4 highlights the fees which directors of the various associations received throughout the period examined. In the FAI, in nominal terms John Delaney was paid a salary of circa €431,000 in 2010, however adjusting for inflation this corresponds to circa €450,000 in 2012 terms. Only the highest paid director in the FA received a higher allowance, of circa €701,000, which is nearly double what the highest paid director of the SFA receives. However, it should be noted that the fee to the highest paid director in the FA has dropped considerably since 2011 (-48%). In contrast the SFA has increased the amount paid to its highest paid director since 2010. Directors’ fees in the other associations are quite substantial in comparison to the Welsh FA. In 2012 €90,000 was paid out in directors remunerations, up from circa €20,000 the previous year. 
Picture
Throughout the period examined both the FAI and English FA undertook considerable costly capital projects. In the FAI’s case this was the reconstruction of the Old Lansdowne Road and new Wembley for the FA. As Table 5 indicates these projects added considerably to both associations long term debt, which has been a focal point of many opinion pieces in regards to both associations. In fact the FAI have acknowledged that they may not be able to achieve their ambition to be debt free by 2020, and having only reduced their long term debt by 3.3% between 2012 and 2011 it is easy to see why. Similarly the FA are extremely determined to reduce their debt burden, so much so that they’ve sold the naming rights to their stadium for both football matches and music concerts. 
Picture

If you build it they will come - Thomond Park drawing the fans

7/12/2013

 
by Elliott Dineen
Picture
Munster rugby has been built on fanatical support and is one of the key elements for the success the province has achieved in recent years. Their renowned passion and atmosphere has been built around their admiration of the icons that have graced the fields of Thomond Park and Musgrave Park. However, recent statistics from the Munster Rugby branch of the IRFU suggests this might not be the case. The common perception is that the “special” individuals within a group or team draw crowds. Few would argue that a return of Irish internationals after the November test matches to any league game would add a significant increase in spectators. In the case of Munster rugby and the redevelopment of Thomond Park, a curious case has seemed to emerge. It seems the size of the stadium could be the main factor.

In the 07/08 season, the IRFU decided to expand Thomond Park from 26,000 from the previous full capacity of 13,200. The previous season saw only one game at full capacity league game with Munster’s ever-present rivals Leinster drawing the crowds. No other game came close to filling the stadium and yet the expansion was approved. This decision was a roaring success. That season, the closest to nearing full capacity, besides the Leinster game, was Connacht at 8,000 attendees. It would be future games like those against Connacht that contribute to the apparent importance of stadia size.

The table below shows, for example, the attendances of Munster’s games against Connacht pre- and post-redevelopment of Thomond Park in the then Celtic League. Musgrave Park held all league games during the 07/08 season due to the reconstruction of Thomond Park. 

Picture
Unusually, after the redevelopment, the game was sold out despite never coming close to achieving so with two significantly smaller stadiums. Connacht being the weakest Irish rivals to Munster, tended to have less enticement to fans.  Note that despite only 3 more internationally capped players in the matchday squad, just under 20,000 more spectators watched the contest in 2008/2009 season. The average attendance figure for the match is equally as significant from the finished expansion period to the 12/13 season. 22,000 people attend the game despite the amount of capped players in the team dropping to 6.7 on average.

It could be said that the significant jump in ticket sales for Thomond’s reopening in 08/09 could be based on Munster’s Heineken Cup triumph the previous season. However, attendances declined the season after Munster’s Maiden victory in the competition in 2005/2006 (This is including capped players playing for Munster remaining largely unchanged.). Therefore, that reasoning is to a certain degree is inconclusive. Leinster matches are the exception to the trend as at least 23,000 spectators have attended the games since the redevelopment with the amount of capped players ranging from 6 – 16 during that period. Games against Edinburgh and Ospreys follow a similar pattern to Connacht. Both playing in Thomond Park and Musgrave Park, viewed in modest numbers prior to returning to the expanded Thomond, only to see an inexplicable rise in ticket sales.

Musgrave Park has seen an increase in attendances of 54.4% with an increase of 21.1% in internationally capped players in the matchday squads over the past 9 seasons. Thomond has seen a 169.45% increase in the same period while there has been a 12.2% decrease in capped players.  Keeping in mind, Thomond Park only sold out three games in the previous three seasons leading up to the expansion. With overall increases in attendees, the statistics further devalues the importance of playing high profile players.

In recent times, fans seem to consider where they watch Munster rather than who is actually wearing the famous red jersey. The point must be made that the fan base has significantly differed before and after the expansion, for league games anyway. If it is not the main factor, it is certainly a notable one. Munster fans may now see Thomond Park as a theatre where its atmosphere is just as important as seeing the players they adore.
Elliott Dineen is a student in BSc Finance Third Year in UCC.

The Numbers Game - a problem?

3/10/2013

 
By Bill Keating
The discovery of this blog and the review of “The Numbers Game” by John Considine led me to read again a part of the book that I had difficulty with on first reading, both as a statistician and a football fan.  However, I was dissuaded from following it up as the authors themselves state that football fans find it hard to accept that football is basically a 50/50 game, half down to skill and half down to luck. I think that, at best, their findings need to be more nuanced.
 
They summarise their conclusions by stating that, almost half the time, the team that is not as well prepared – or has worse players, a raft of injuries, or is just not as good – ends up winning. I find that hard to accept and do not think it is supported by their own data. This data, for obvious reasons, is not presented in full but is summarised in charts.
 
Now if they had said that any given game was decided on a 50/50 basis, I could accept that. So, if one team was vastly superior in skill, then the other team would need an outrageous amount of luck to beat them. This is consistent with the sort of results achieved in Spain by Barcelona and also with the major upsets quoted by the authors. However, that is not how they phrase their conclusions.
Picture
The authors chart (Figure 11) show the favourites winning  just over 50% of the time. If we allow for draws, this does not tally with the finding quoted above. They do point out that there are more marginal favourites in football than in most other sports. If we ignore these and concentrate on those where the favourites are fancied 50% more, then the proportion winning is  65% or more. This suggests, allowing for draws, the underdogs only win  something like 20% of the time – a far cry from 50/50.

In any event, the reasons why even strong favourites will not always win are not just down to chance. In football especially, the underdog has the possibility of playing for a draw as goals are such a rare event. This is in contrast to sports where territorial dominance almost inevitably leads to victory (rugby and hurling are clear examples). Apart from playing for a draw, a so called upset can be down to many factors other than chance.
 
The underdogs may have a better tactical plan. I am fairly sure Barcelona were strong favourites to beat Inter a few years ago but the defensive strategy of Inter won out. Mental attitude may also play a part with favourites being over confident and so not preparing as well as they should. All in all, I do not accept that the poorer team ends up winning almost half the time. This is not consistent with the data presented and the finding needs to be more nuanced.

(Bill Keating worked as a statistician with the Central Statistics Office.)

<<Previous

    Archives

    March 2023
    February 2023
    January 2023
    December 2022
    November 2022
    October 2022
    September 2022
    August 2022
    July 2022
    June 2022
    May 2022
    April 2022
    March 2022
    February 2022
    January 2022
    December 2021
    November 2021
    October 2021
    September 2021
    August 2021
    July 2021
    June 2021
    May 2021
    April 2021
    March 2021
    February 2021
    January 2021
    December 2020
    November 2020
    October 2020
    September 2020
    August 2020
    July 2020
    June 2020
    May 2020
    April 2020
    March 2020
    February 2020
    January 2020
    December 2019
    November 2019
    October 2019
    September 2019
    August 2019
    June 2019
    May 2019
    April 2019
    March 2019
    February 2019
    January 2019
    December 2018
    November 2018
    October 2018
    September 2018
    August 2018
    July 2018
    June 2018
    May 2018
    April 2018
    March 2018
    February 2018
    January 2018
    December 2017
    November 2017
    October 2017
    September 2017
    August 2017
    July 2017
    June 2017
    May 2017
    April 2017
    March 2017
    February 2017
    January 2017
    December 2016
    November 2016
    October 2016
    September 2016
    August 2016
    July 2016
    June 2016
    May 2016
    April 2016
    March 2016
    February 2016
    January 2016
    December 2015
    November 2015
    October 2015
    September 2015
    August 2015
    July 2015
    June 2015
    May 2015
    April 2015
    March 2015
    February 2015
    January 2015
    December 2014
    November 2014
    October 2014
    September 2014
    August 2014
    July 2014
    June 2014
    May 2014
    April 2014
    March 2014
    February 2014
    January 2014
    December 2013
    November 2013
    October 2013
    September 2013
    August 2013
    July 2013

    About

    This website was founded in July 2013.

    RSS Feed

    Categories

    All
    American Football
    Athletics
    Baseball
    Basketball
    Behavioural Economics
    Boxing
    Broadcasting
    Competitive Balance
    Cricket
    Cycling
    Darts
    David Butler
    Declan Jordan
    Drugs
    Ed Valentine
    Epl
    Esports
    Expenditure
    F1
    Fifa World Cup
    Finances
    Funding
    Gaa
    Gaelic Games
    Gambling
    Game Theory
    Gary Burns
    Geography
    Golf
    Greyhound Racing
    Guest Posts
    Horse Racing
    Impact Studies
    John Considine
    John Eakins
    League Of Ireland
    Location
    Media
    Mls
    Mma
    Olympics
    Participation
    Paul O'Sullivan
    Premier League
    Regulation
    Research
    Robbie Butler
    Rugby
    Simpsonomics
    Snooker
    Soccer
    Spatial Analysis
    Sporting Bodies
    Stephen Brosnan
    Swimming
    Taxation
    Teaching
    Technology
    Tennis
    Transfers
    Uefa
    Ufc
    World Cup
    Wwe

Related

The website is not formally affiliated to any institution and all of the entries represent the personal views and opinions of an individual contributor. The website operates on a not-for-profit basis. For this reason we decline all advertisement opportunities. 

Contact

To contact us email sportseconomics2013@gmail.com or find us on Twitter @SportEcon.