The Economics of Sport
  • Sports Economics
  • About
  • Workshop
  • Selected Publications
  • Book Reviews
  • A Primer on Gaelic Games
  • Upcoming Events
  • Media
  • Education
  • Resources & Links
  • Data

The Trend In Ryder Cup Points

25/9/2014

 
By Robbie Butler

Today marks the eve of one of my favourite events in sport; the Ryder Cup. While I would not consider myself a regular viewer of golf on TV (except for the Majors) my fascination with the Ryder Cup goes back to 1991 and ‘that putt’ by Bernhard Langer. Defeat at Kiawah Island in South Carolina that year sparked my interest in the event and I couldn't wait for the next bruise-up between the two teams.

1993 was no different. Team USA proved too strong in the single pairings and ran out 15-13 winners at the Belfry. However, this was the last time the USA tasted victory on European soil. In the 8 Ryder Cups that have followed, Team USA has managed to win just two (1999 and 2008). In fact, since Europe's defeat at the Belfry, the team has enjoyed somewhat of a golden era which included crushing defeats of their American counterparts at Oak Hill, NY in 2004 and our very own K Club in County Kildare in 2006, both by a margin of points 18.5 to 9.5.

The data suggests Europe is on the up also. The graphs below plots the number of points each team has won since the competition became USA versus Europe in 1979. The first graph included Europe’s run away wins in both 2004 and 2006. The second graph excludes them (for purposes of the trend). 
Picture
Picture
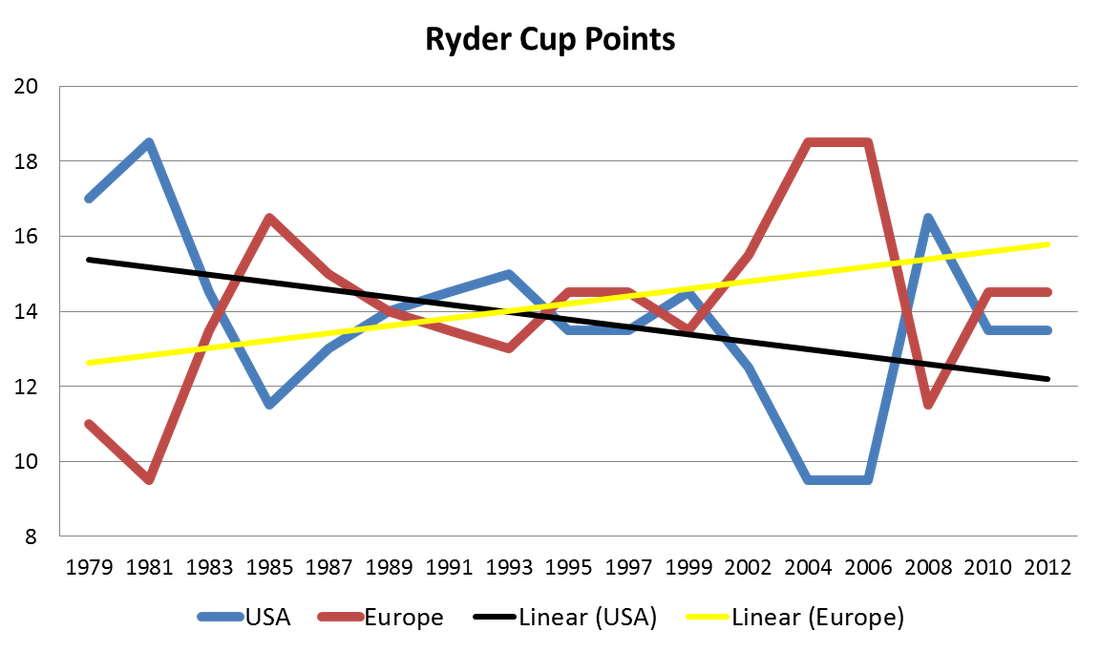
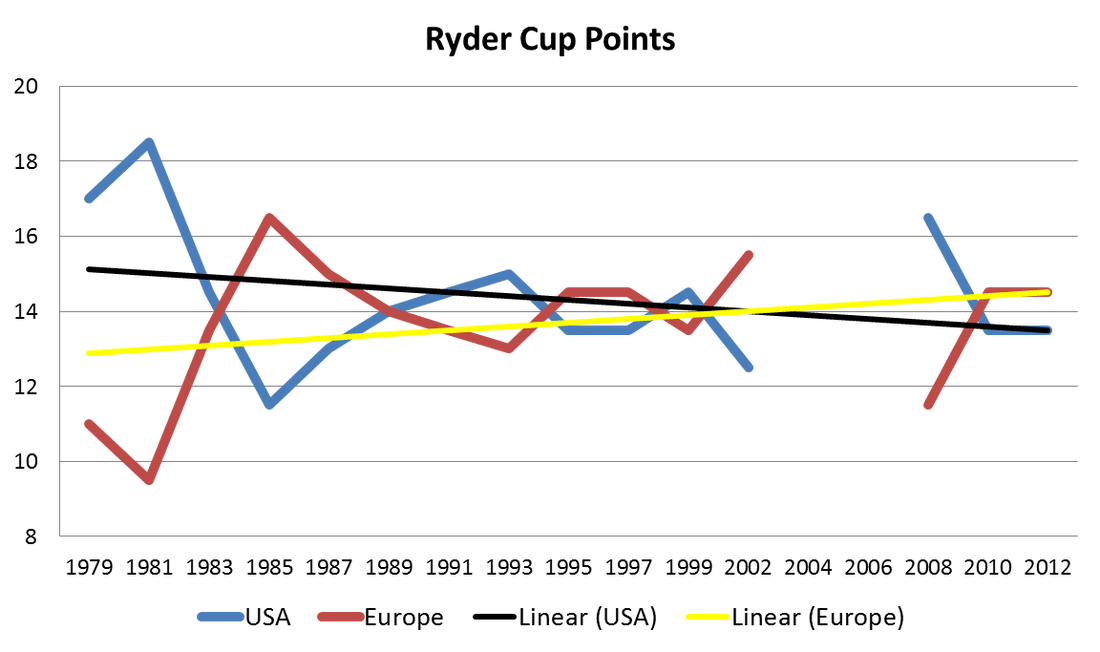
Regardless of the graph, Europe’s points are trending upwards; the USA downwards. Since 1979 the USA has won a total of 216 points, with a mean of 14.4 points per tournament. Europe has won a slightly less 204.5 points, with a mean of 13.63. 

Remember 14 points are all that is required to retain this Ryder Cup. Let’s hope the 2014 European team can continue the upward trend and push that average even closer to the magic number 14.

Golfing Report

6/9/2014

0 Comments

 
By John Considine
Last month the Financial Times produced a Special Report on the state of golf.  In the space of six pages, less the space devoted to adverts, the newspaper produced a wide ranging overview of the game.  It included an examination of the environmental issue in California, the influence of social media, and the use of online simulators.  The major issue discussed was the drop in participation in mature markets, the possible causes, and potential solutions.

The lead article by Roger Blitz acknowledged the positives for the game.  These include the growing TV revenues, steady viewership figures, well rewarded elite players, recognisable new markets, and the fact that the game will feature in the 2016 Olympics.  Yet, the article was titled 'Sport stuck in a rut has to get a grip on its future' (allowing for the fact that the title may well have been chosen by a sub-editor).  According to Blitz, the rut that golf is stuck in appears to be its image problem.  It is viewed as "boring".  And, the reason it is stuck in that rut is because of the power structure of the sport.  It is run by amateur players in charge of governing bodies and there is a problem with competition between the US and European tours.

Another problem that golf has is its format.  Richard Gillis documents how those less time constrained over 65 averaged a round a week whereas those under 30 averaged only seven rounds a year.  Time constraints are one of the problems contributing to a massive decrease in participation.  Gillis quotes the head of the National Golf Foundation in the US saying one six golfer were lost to the game over that last decade.  The fall in participation is one of the reasons for a drop in sales of golf equipment.  An increase in supply has resulted in large decreases in price.  Ed Stack, chief executive of Dick's Sporting Goods, says that in the space of 20 months drivers that were selling for €299 are now retailing for €99.  As a result, Dick's Sporting Goods announced it would lay off about 500 PGA-qualified professionals it employs to sell golf equipment. 

The drop off in participation in primarily amongst males in mature markets.  Sarah Stirk explains how the female market is growing - although not a quickly as it might.  One of the problems attracting female golfer is the discrimination against females when it comes to access.  While it is acknowledged that things are improving, it is also clear that there is a distance to equality.

There are clear growth opportunities in less developed markets.  According to Samantha Pearson there are only 120 golf courses in Brazil whereas a country of comparable size (the US) has 15,000 courses.  However, the difficulties constructing the course for the Olympics in 2016 could be symptomatic of problems in growing these markets.

There are many interesting articles in the Financial Times Special Report but the one I liked best was the one by Richard Gillis titled 'A lament for the lost art of shot-making'.  The title gives a good indication of what is in the article.  One of the fascinating observations by Fred Couples is the change in driving distance over the last 30 years.  He earned the nickname "boom, boom" when he was averaging a driving distance of 280 yards.  Nowadays, he says, the game passes by those who don't hit it 320 yards.  This observation is consistent with a previous post on this blog (here).  To what extent is this improvement due to human improvement or improvement in the equipment?  If this improvement manifested itself in cycling then it would be attributed to drugs.  Maybe golf does not have as big an image problem as other sports.
0 Comments

A Wire-to-Wire Winner in the British Open?

16/7/2014

 
By Aidan Moynihan
Picture
The second of golf’s four annual majors, the U.S. Open was this year played at Pinehurst in North Carolina, U.S.A. from June 12 – June 15. The competition produced a “wire-to-wire” winner whereby Martin Kaymer led at the  completion of all four rounds. Kaymer scored rounds of 65–65–72–69 to win. The following week in the Irish Open, Mikko Ilonen produced the same feet in recording another wire-to-wire success. What are the chances of another such win at the forthcoming British Open Championship?
 
The Open Championship, or the British Open as it is also known by, will be played at Royal Liverpool (Hoylake), from July 17 – July 20. The third of golf’s annual major’s is played on alternating venues each year and this will be the first event at Royal Liverpool since 2006, where Tiger Woods successfully defended the Claret Jug. On this occasion Woods lead the field after the completion of rounds 2 and 3. He was in second place at the completion of round 1. 
 
In the past 20 years there has been only 1 wire-to-wire winner of the event. That was Tiger Woods in 2005 at St. Andrews. Woods recorded rounds of 66-67-71-70 to win by 5 shots over his nearest competitor. In 1995, also at St. Andrews, John Daly had a share of the lead at the completion of both rounds 1 and 2, before dropping to 4th place in round 3 and eventually winning in a playoff.

When analysing the past 20 years of Open data it can be seen that while wire-to-wire successes are uncommon, the eventual winner does tend to well placed on the leader board at the end of round 1. In-fact, 10 of the past 20 winners were placed fifth or better after round 1, 14 of the last 20 winners were all placed inside of the top 10 after round 1. 

Picture
In 1999 at Carnoustie, Paul Lawrie was in 4th position after round 1. However, he entered the final round in 14th position before overcoming a British Open record 10 shot deficit after 54 holes, to win in a playoff. The event is best remembered for the actions of Jean Van De Velde more than those of Lawrie. 

The worst placed winner at the completion of round 1 was Mark O’Meara at Birkdale in 1998. O’Meara was in 62nd  position after round 1 but his good second round moved him into 6th position after 2 rounds. Similar scenarios occurred with Todd Hamilton at Royal Troon in 2004 and Padraig Harrington in 2008 at Royal Birkdale. Hamilton was in 40th position after round 1 but his second round saw him move into 5th position after 2 rounds. Harrington meanwhile, was in 38th position after round 1, before moving into 4th position after round 2 along the way to  successfully defending the championship.

When looking at the position of the winner after the second round the trend becomes even clearer. Eight of the last 20 winners were actually leading the British Open after 2 rounds. Thirteen out of 20 were placed fifth or better while 16 out of 20 were inside of the top 10 after 2 rounds. David Duval at Royal Lytham and St. Anne’s, in 2001, was in 35th position and so represents the greatest comeback of the past 20 winners.
Picture
While not impossible, the talent in the field makes it unlikely that we will have a wire-to-wire winner in the forthcoming Open Championship. An analysis of the last twenty years suggests that the winner will be well placed at the end of round 1. If not, they will be after round 2. Perhaps it would be wise to wait until Friday evening before attempting to predict the winner.

Local Economy  & The Irish Open

28/6/2014

 
Picture
By Robbie Butler

Playbooks and Checkbooks is the title of the 2009 book by sports economist Stefan Szymanski. In the book Szymanski considers the impact of sport on our lives and asks whether the sports business generally shares its gains with the citizens supporting it.

One of the more interesting chapters is called “Sports and the Public Purse”. The author examines what is known as the “sporting money illusion” – the theory that sporting events bring large amounts of income into a host city, country or region. Szymanski goes on to illustrate how this is not the case with the use of examples at the national level.

Here’s a micro example. I managed to get to two days of the Irish Open at Fota Island Resort recently. Many people might have had the view that Cork, and indeed Ireland, benefits economically from this event. Is this so?

It all depends on where people come from.

By far the majority of people at the event were from Cork itself. Their decision to attend the event does almost nothing for the local economy, expect possibly increase the velocity of money in circulation. This is obviously debatable. A resident of Cork (spending money in Fota at the event) is simply substituting their consumption. e.g. cinema is quieter, restaurants less full, city centre bars not as busy.

Irish residents not from Cork, and attending the event, do boost the local economy. Money spent in Fota or the surrounding area would probably not have been spent in Cork hence the city and/or county are better off. As a result, one can argue that the event has large local economy benefits. On the flip side however other counties lose out, be it Dublin, Kerry, etc. Furthermore, these Irish residents bring no net gain to the Irish economy. GDP is no bigger.

The only benefit to the Irish economy comes from international visitors. I can tell you these were few and far between at the Irish Open. However, the income they spend is a win-win from both Cork and Ireland. Hotel rooms, restaurants, bars, etc. all benefit from their presence and the money is additional to what would have been spent had the Irish Open not been here.

So next time some tells you how much an event is worth to the local economy, consider if it is does anything at the national level. More often than not people mistake local benefit with a substitution effect.

Drive for Dough

3/6/2014

0 Comments

 
By John Considine
Almost twenty years ago Bob Rotella published his best-selling book Golf Is Not A Game of Perfect.  Rotella's background is psychology and it was his application of psychology to golf that brought him to sporting prominence.  Tom Kite wrote the foreword for the book and he testifies to the important influence Rotella had on his career.  In chapter 9 Rotella lists an impressive range of golfers who have benefitted from redirecting their attention away from their long-game towards their short-game.  But he admits there are some golfers that he cannot help improve.  He says about such a player, "this is a player who cannot accept the fact that low scores depend on how well a golfer plays once the ball is within about 120 yards of the hole. This is the player who persists in thinking that golf is about who hits the longest drives or the prettiest 3-irons".

Picture
Rotella might revise his views given the changes to the Professional Golfers' Association Tour in the meantime.  According to a recently published paper in the Journal of Sports Economics, the average length of the golf courses on the tour has increased, the height of the rough has been reduced, cups have been repositioned to harder locations, while there has been no increase in the number of bunkers.  The authors suggest that these changes should have increased the returns to driving relative to putting.  Examining the data, the authors of the paper find that this is in fact the case.  Carson Baugher, Jonathan Day and Elvin Burford find that prior to 2011, putting ability was the most important determinant of earnings.  In 2011 this changed with driving distance becoming the most important determinant of earnings.  Putting slipped to second place in 2011 and remained there in 2012.  In 2013 putting slipped to third behind driving distance and driving accuracy.

A key year in their analysis is 2008 when "the average length of the golf course on the PGA Tour increased by 37.4 yards".  From that year there is a dramatic increase in the returns to driving length and accuracy.

To illustrate their argument on earning they compare the 2013 earnings of Bubba Watson and Bryce Molder.  Watson was the 5th longest driver and 122nd best putter.  Molder drove the ball 14 years less than the average golfer but was the 4th best putter.  Watson earned $1.8m while Molder earned $0.8m.  Eight of the top 10 drivers earned more than $1m whereas only 5 of the top 10 putter earned over $1m.

Carson, Day & Burford suggest that the old saying "drive for show and putt for dough" should be replaced by "drive for dough in order to putt for dough".

The evidence presented in the paper is not incompatible with Rotella's views.  However, it clearly attaches a greater importance to driving than one might get from Golf Is Not A Game of Perfect.  One of the things I found most interesting about the paper is my reaction to it.  If someone asked me to guess which of two golfers earned more money, and they said one was a better driver while the other was better from 120 yards to the hole, then I would go with the golfer that was better over the last 120 yards.  I find it hard to rationalise my choice.

0 Comments

Why do golfers earn more than tennis players?

12/8/2013

 
by Declan Jordan
Last Saturday week (July 27), Johnny Watterson wrote in the Irish Times about the inequality in prize-money in tennis relative to golf. He compared two recent major winners in each sport, Marion Bartoli at Wimbledon and Phil Mickelson at the Open. He said
So Marion Bartoli endures laddish stick from John Inverdale, puts a trembling Sabine Lisicki to the sword and walks away €183,350 richer for a fortnight at Wimbledon than Phil Mickelson did for winning the Scottish Open and British Open in successive weeks. That’s no surprise to those in the lower rungs of tennis, where new racquet strings and food poisoning are more pressing than the fantasy of a staged warm down or massage session.

The Californian lefty earned €579, 080 for his Scottish Open win and €1,097,570 from Muirfield, while Bartoli took €1.86 million for her 1 hour 21 minute win over Lisicki.
Picture
The point is that at the elite end of the sport, tennis players earn as much as their golfing counterparts. However, moving down the ranking list the earnings of golfers far outstrip those of tennis players. Of course, why the comparison is made between Bartoli and Mickelson, rather than Murray and Mickelson is unclear. It should be noted that since 2007 men and women earn the same prize money at Wimbledon. It's also a little misleading to say that Marion Bartoli won €1.86m for her final victory over Sabine Lisicki. It's a little like saying Phil Mickelson won just over €1m for his final putt on Sunday at Muirfield. In fact Bartoli won £800,000 for winning the final. She had already earned that amount at a minimum by winning her previous 6 matches.

The analysis referred to in the Irish Times article comes from a report by Tennis New Zealand on the 'Tennis Poor'. The article points out, among other evidence, that:

The 400th ranked golfer on the money list earned $203,000 (€153,470) in 2011. To reach that kind of income in men’s tennis, a player in 2012 needed to be ranked 137 in the world and a woman needed to be ranked 107.

The Kiwis used the comparison with golf to show how the money alarmingly falls off in tennis after the 200 mark and how the game of Mickelson and McIlroy better catered for their entirety of players.

In 2012 the 200th ranked male on the ATP Tour earned $98,000 (€74,000). In golf the 200th ranked male that year earned $639,000 (€483,000). In 2012 the 250th male on the ATP Tour did not make any profit, while the equivalently ranked golfer made $461,000. Golf in fact kept on giving with the 300th ranked player earning $358,000 (€271,000) and the 350th male taking $264,000 (€200,000).
The report "noted that, given choice, it made more economical sense for an aspiring athlete to play golf." Some may be less sympathetic to tennis players at lower income levels. There are many professions where the elite earn significantly more than the other 99% of those in the profession. I am sure Paul Krugman earns more than I do and if I was unable to earn a living as an economist would I able to convince our Nobel laureates to reduce their salaries and talking fees to help University College Cork to keep me on? I would expect a tough time.

But of course this analysis is overly simplistic because economists do not 'compete' as sports people do and sports people require competition and rivalry, without which no sport exists. In any event, in this post I am more interested in trying to explain at least some of the difference in earnings between the two sports (golf and tennis). 
Picture
The first aspect is being in the top 400 golfers in the world may not be equivalent to being in the top 400 tennis players in the world. It is very difficult to get an idea of how many people play each sport. Golf World suggests there were 61m golfers in the world in 2003. Of these, 37.1m were in America. I couldn't find a comparison for tennis, but the Tennis Industry Association claim 27.1m tennis players in the US in 2011. Even assuming no growth in the number of golfers since 2003 and assuming the same proportionate relationship in the rest of the world as the US, it's likely that there are more golfers than tennis players. This means it's harder to be a top ranked golfer than a top ranked tennis player simply by weight of numbers. This however can't completely explain difference in prize money earnings. 

Another, possibly more convincing, explanation has to do with the structure of competition in each sport. Golf typically has 'first past the post' tournament styles. In a field of up to 120 golfers only one can win and it can be clear after the first round (maybe even sooner) whether a particular golfer is likely to win or not. So how can organisers of tournaments incentivise competitors to keep playing and trying even when it looks like they will finish well down the field. The prize money at the Open at Muirfield shows that there are incentives for players to finish one place higher in the tournament rankings. (Of course some tournaments will also pay appearance fees to select golfers- though this will not affect effort directly so we can ignore this for the purpose of this argument). It's also notable from that prize list that players who miss the cut also receive prize money. 

Tennis tournaments are generally operated on a knock-out basis. This means that the incentive structure has to be such to encourage the player to win the current match. A relatively smaller fee for winning the marginal match will be sufficient incentive to encourage players to put in greater effort. The Wimbledon prize fee structure shows that players will be incentivised by the increased prize from each game. It also means that while one great match will win a lower ranked player some prize money but this is less likely to happen over a week or two-week long tournament. 
In both sports of course the non-prize money earnings are very important elements of overall income. Golfers tend to have significant tournaments each weekend, attracting significant sponsorship (and related prize money). The higher prize money attracts the best golfers which attracts the bigger sponsors. And more players can play in each tournament. Typically in a knock-out tournament with one game per day (at most) there is a limit in the number of players that can be accommodated at the higher ranked tournaments (not all tournaments can run for two weeks like the majors). This limits the opportunities for lower ranked players to play at the top tournaments with the better money. 
Forward>>

    Archives

    May 2023
    April 2023
    March 2023
    February 2023
    January 2023
    December 2022
    November 2022
    October 2022
    September 2022
    August 2022
    July 2022
    June 2022
    May 2022
    April 2022
    March 2022
    February 2022
    January 2022
    December 2021
    November 2021
    October 2021
    September 2021
    August 2021
    July 2021
    June 2021
    May 2021
    April 2021
    March 2021
    February 2021
    January 2021
    December 2020
    November 2020
    October 2020
    September 2020
    August 2020
    July 2020
    June 2020
    May 2020
    April 2020
    March 2020
    February 2020
    January 2020
    December 2019
    November 2019
    October 2019
    September 2019
    August 2019
    June 2019
    May 2019
    April 2019
    March 2019
    February 2019
    January 2019
    December 2018
    November 2018
    October 2018
    September 2018
    August 2018
    July 2018
    June 2018
    May 2018
    April 2018
    March 2018
    February 2018
    January 2018
    December 2017
    November 2017
    October 2017
    September 2017
    August 2017
    July 2017
    June 2017
    May 2017
    April 2017
    March 2017
    February 2017
    January 2017
    December 2016
    November 2016
    October 2016
    September 2016
    August 2016
    July 2016
    June 2016
    May 2016
    April 2016
    March 2016
    February 2016
    January 2016
    December 2015
    November 2015
    October 2015
    September 2015
    August 2015
    July 2015
    June 2015
    May 2015
    April 2015
    March 2015
    February 2015
    January 2015
    December 2014
    November 2014
    October 2014
    September 2014
    August 2014
    July 2014
    June 2014
    May 2014
    April 2014
    March 2014
    February 2014
    January 2014
    December 2013
    November 2013
    October 2013
    September 2013
    August 2013
    July 2013

    About

    This website was founded in July 2013.

    RSS Feed

    Categories

    All
    American Football
    Athletics
    Baseball
    Basketball
    Behavioural Economics
    Boxing
    Broadcasting
    Competitive Balance
    Cricket
    Cycling
    Darts
    David Butler
    Declan Jordan
    Drugs
    Ed Valentine
    Epl
    Esports
    Expenditure
    F1
    Fifa World Cup
    Finances
    Funding
    Gaa
    Gaelic Games
    Gambling
    Game Theory
    Gary Burns
    Geography
    Golf
    Greyhound Racing
    Guest Posts
    Horse Racing
    Impact Studies
    John Considine
    John Eakins
    League Of Ireland
    Location
    Media
    Mls
    Mma
    Olympics
    Participation
    Paul O'Sullivan
    Premier League
    Regulation
    Research
    Robbie Butler
    Rugby
    Simpsonomics
    Snooker
    Soccer
    Spatial Analysis
    Sporting Bodies
    Stephen Brosnan
    Swimming
    Taxation
    Teaching
    Technology
    Tennis
    Transfers
    Uefa
    Ufc
    World Cup
    Wwe

Related

The website is not formally affiliated to any institution and all of the entries represent the personal views and opinions of an individual contributor. The website operates on a not-for-profit basis. For this reason we decline all advertisement opportunities. 

Contact

To contact us email sportseconomics2013@gmail.com or find us on Twitter @SportEcon.