by Declan Jordan
I am seeking a graduate that is interested in undertaking a funded MSc by Research. This is a one year programme and the funding will cover fees and a small stipend.
Candidates are required to have a degree in a relevant discipline (e.g. Arts with Economics, Commerce, etc) and ideally be familiar with survey methods and data analysis. I am looking for someone to begin the project as soon as possible.
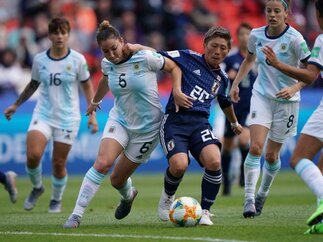
The aim of the project is to explore the prevalence and extent of succession planning for volunteering in sports in Ireland. In addition, the research will provide insights on the experience of volunteers and clubs during the COVID pandemic and the effects of this on volunteer activity, motivation, and intentions to volunteer. The primary research questions are the extent to which volunteers perceive and clubs engage in structured processes of role transition and succession for volunteers and whether and how much volunteer motivation, workload, commitment, and intention been affected by the COVID pandemic.
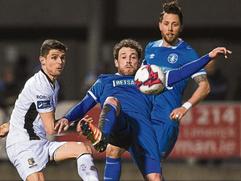
The project will gather original survey data from a representative sample of volunteers in sport and from club administrators. The project will involve working closely with a prominent Irish sporting organisation.
If you are interested and/or would like more information please email Declan Jordan at d.jordan @ ucc.ie.
Candidates are required to have a degree in a relevant discipline (e.g. Arts with Economics, Commerce, etc) and ideally be familiar with survey methods and data analysis. I am looking for someone to begin the project as soon as possible.
The aim of the project is to explore the prevalence and extent of succession planning for volunteering in sports in Ireland. In addition, the research will provide insights on the experience of volunteers and clubs during the COVID pandemic and the effects of this on volunteer activity, motivation, and intentions to volunteer. The primary research questions are the extent to which volunteers perceive and clubs engage in structured processes of role transition and succession for volunteers and whether and how much volunteer motivation, workload, commitment, and intention been affected by the COVID pandemic.
The project will gather original survey data from a representative sample of volunteers in sport and from club administrators. The project will involve working closely with a prominent Irish sporting organisation.
If you are interested and/or would like more information please email Declan Jordan at d.jordan @ ucc.ie.


 RSS Feed