The Economics of Sport
  • Sports Economics
  • About
  • Workshop
  • Selected Publications
  • Book Reviews
  • A Primer on Gaelic Games
  • Upcoming Events
  • Media
  • Education
  • Resources & Links
  • Data

Darts Players are Getting Better Too

24/4/2018

 
By David Butler

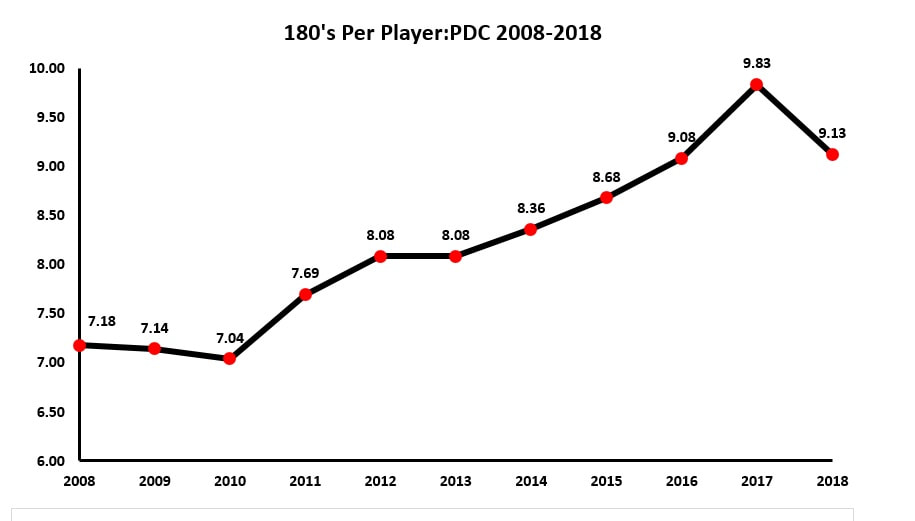
Last week John Eakins looked at the ‘increase in perfection’ for snooker players scoring a 147 (maximum) break. See his post below. He mentioned darts as another sport (?) where the ultimate display of skill can be achieved. As 9-dart-finishes are so rare, here I look at the average number of 180 throws for the PDC tournament over ten years (2008-2018). 180 is the highest score possible with three darts. Perhaps it can be thought of as a type of ‘mini-perfection’ for any given set of three darts. A 180 is recognisable as it is typically greeted with an animated announcement from the commentator and loud roars from watching spectators.  

The chart below shows the average number of 180’s, adjusting for the number of players, for eleven years of data from 2008 to 2018.  Typically, the allocation of these 180 data are skewed for any given tournament given that it is a knockout design.
Picture
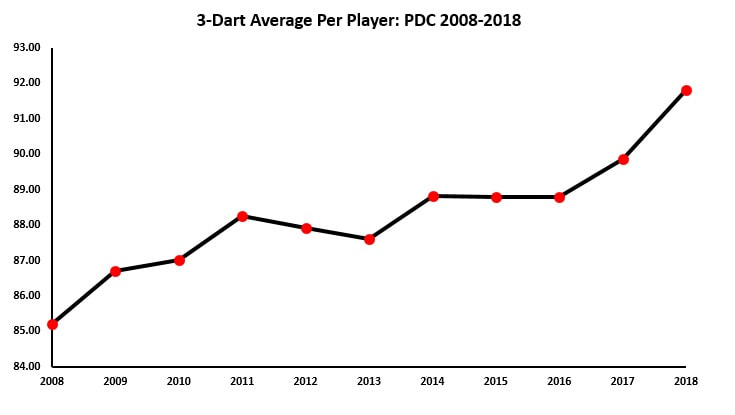
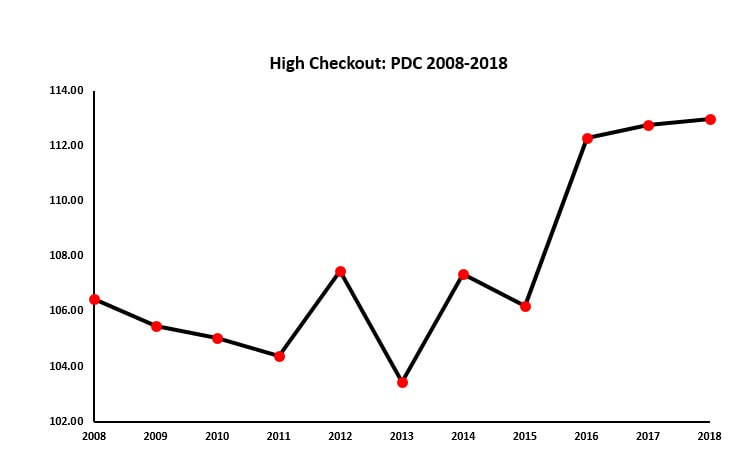
The next two charts show other measures of improved performance in the PDC over ten years. These consider the 3-dart averages per player and high checkout averages. I guess all of these measures are correlated and shouldn’t be thought of as independent but rather showing a similar trend.

Like snooker, the equipment in darts hasn’t changed that much over the years, hence technological change may only marginally effect player ability. Improved performances could be due to increased practice, rules to improve professionalism and other incentives such as increased prize money.
Picture
Picture

The Southwell 13

6/3/2018

 
By David Butler

To my knowledge a new record was set at Southwell Racecourse last Friday when just 13 paying customers arrived at the track. The bitter cold and schedule reorganisation were offered as reasons for the surely record breaking turnout.  

The data on attendance at UK meetings from 1989 to 2015 shows that prior to Southwell last Friday, the previous lowest attendance was at Wolverhampton in December 2012. This meeting was held three days before Christmas – 111 showed up and only 5 bookmakers were present on course.

From 1989 to 2015, 952 UK meetings have attracted below 500 punters. The data shows that 644 (67%) of these were held at Wolverhampton racetrack. Southwell held the second highest percentage of meetings with under 500 attendees - 123 meetings (19%). Along with Lingfield, these meetings at these tracks appear to be designed for bookmakers shops and off-course bettors rather than racegoers. It is also the case that the vast majority of races run at these tracks are on an all-weather surface. Wolverhampton Racecourse only hosts all-weather events on its recently installed Tapeta surface.

The weather, and perhaps the Christmas season, appear to be important regulators for meetings in this <500 club too. The chart below shows the data by month for the 952 meetings. Typically, these events fall into months with adverse weather conditions. While not denying the importance of race quality and facilitates,, this might be something authorities need to consider more when organising the racing calendar to help smaller racetracks improve attendances. That is of course, if the motivation is to attract greater attendances.
Picture

The Value of the FA Cup

18/1/2018

 
By David Butler

The growth of the Premier League and European football since the turn of the century seems to have worn the gloss off the FA Cup for fans of elite clubs.  From time-to-time ‘the magic of the cup’ is revived – the 94th minute equaliser of Jamal Lewis being a timely reminder last Wednesday. These moments are rare however and typically two teams from the top level of English football reach the FA cup final. Millwall and Cardiff are the only two teams from outside the top flight to make the final this century and the last second tier team to win the competition was West Ham. Trevor Brooking gave the Hammers a 1-0 win against Arsenal in the 1980 final. Given the progress of the Premier League, I wonder will this ever happen again. 

The economic value associated with avoiding relegation from the Premier League or earning a Champions League spot, has resulted in managers prioritising league ambitions, often resting key players for Cup matches. This makes economic sense for the elite as, over time, the sums associated with Premier League success have dwarfed FA Cup payments.  

The payments for this year’s competition are below:

Extra preliminary round winners (185) - £1,500
Preliminary round winners (160) - £1,925
First round qualifying winners (116) - £3,000
Second Round Qualifying winners (80) - £4,500
Third Round Qualifying winners (40) - £7,500
Fourth Round Qualifying winners (32) - £12,500
First Round Proper winners (40) - £18,000
Second Round Proper winners (20) - £27,000
Third Round Proper winners (32) - £67,500
Fourth Round Proper winners (16) - £90,000
Fifth Round Proper winners (8) - £180,000
Quarter-Final winners (4) -£360,000
Semi-Final winners (2) -£900,000
Semi-Final losers (2) -£450,000
Final runners-up (1) - £900,000
Final winners (1) - £1,800,000

Of course, there is another side to this. For smaller clubs a draw against a Premier League team can lead to a windfall and a good cup run can be very lucrative.

The last 32 is decided next weekend with two David vs. Goliath clashes. Newport County AFC take on Tottenham Hotspur and Yeovil Town play Manchester United. The competition rules state that “matches played in the Third, Fourth, Fifth Rounds and Quarter-Final of the Competition Proper, the net gate receipts of each match shall be divided as follows: 45% to each Club competing in the match. 10% to the Pool.” Newport County ground Rodney Parade has a capacity of 7,850 (and the club are trying to install additional seats). Yeovil town’s Huish Park has a capacity of 9,565 (5,212 seated). Surely both will be full houses and both clubs can also expect their revenues to be boosted by TV money.

As the old joke goes, the board of directors of these minnows may prefer a draw to scooping the £90,000 for winning the tie. If either Yeovil or Newport do achieve a draw, the economic value of a replay should not be understated. Although the take of gate revenue is lower for replays (42.5% to each Club), this would represent a major windfall. Here’s some very very casual estimates

-Tottenham attracted 47,527 fans to Wembley to watch Tottenham vs. AFC Wimbledon in round three. If the same number watched a replay at circa £15 a ticket (the round three price) Newport would take approximately 300k away.  
-Manchester United had 73,899 fans at Old Trafford for their match against Derby in round three. At circa £40 a ticket, Yeovil could leave with over a million pounds.

While the magic of the Cup may be wearing off for fans of big clubs, the (economic) magic for small clubs is alive and well. With Premier League teams expanding stadiums, and building new ones, the value of a good cup run for small clubs could be more attractive than ever.

Population & Points Total - 2018 FIFA World Cup qualification (UEFA)

15/11/2017

 
By David Butler

Earlier this week the Economist newspaper told the now quite well-known story behind the rise of Iceland. The article is called “How Iceland (population: 330,000) qualified for the World Cup”. In short, it’s a story of investment and good organisation. Pouring resources into infrastructure such as artificial surfaces for schools and upskilling coaches, coupled with some savvy tactics, has steered Iceland to another major international competition.

The population figure stood out the most for me. With that in mind, I plotted the relationship between male population levels (log) for UEFA entrants and the amount of points earned over the 2018 UEFA World Cup Qualification phase.
​
The graph considers 53 entrants from the UEFA confederation. The population data was accessed from Eurostat and official labour market statistics for the individual UK countries. The population figures represents the male population level for 2016. 
Picture
I've included some flags on the map to give an indication of some of the countries. Germany has the highest possible pool to select from (40,514,123) and has also scored the highest of points this campaign – 30. Having access to a big pool and high levels of investment usually translates to success.

As for ourselves, Ireland totalled 19 points from a population of 2,335,733 males. Northern Ireland, also reached 19 points with just a population of 232,804 – that’s not far behind Iceland.

You’d have to be worried for the minnows that failed to earn a point. San Marino, Liechtenstein and Gibraltar will probably always struggle, saving a significant population growth; they select a squad from a pool of under 20,000 men.  
For Iceland, Eurostat reports a male population figure of 167,270. For a 23-man World Cup squad, approximately one in every 7,000 Icelander has a chance of making it! Population is clearly important but the Iceland story reminds us that this is not an iron relationship. 

The 'Champions Route' & Uncertainty of Outcome

13/9/2017

 
By David Butler

Last night’s Champions League results made me think, once again, about the structure the competition.  The thrashing of Celtic at the hands of PSG (Pot 2) and Chelsea’s (Pot 1) demolition of Qarabag FK were examples of elite teams taking on an opponent that qualified via the playoff’s ‘Champions Route’ and were seeded in Pot 4 for the group stages.

To give the background to this first. For the 09/10 Champions League a new system was introduced that created two separate qualifying tournaments prior to the group stages. The Champions Route was established for clubs that win their domestic league competition but do not automatically qualify for the Group Stages.  Generally speaking, this has allowed historically smaller clubs from weaker leagues to have entrants in the Group Stages of the Champions league.The non-champions route, which begins from the third qualifying round, is reserved for clubs that do not win their domestic league. 

While this may be good in terms of representation, I think it’s having implications for uncertainty of outcome – many groups are now dead rubbers.

Looking at the basic stats for team that qualified via the Champions Route and were seeded in Pot 4 lends to this view:
  • Since the introduction of the new system in 09/10 only two Champions Route teams have qualified from the group stages – APEOL and Celtic. Three quarters of the team’s finish last in the group. Seven teams have lost all six group matches.

  • Since 09/10, from the 34 teams that qualified via this means, and were placed in pot 4, only 118 points have been collected over eight seasons of the Champions League.  

  • Only 22 points have been collected when playing against top seeds, and top seeds have been defeated only 4 times. CFR Cluj, Celtic, BATE Borisov and APOEL have this honour.
 
  • The top seeds have scored 78 goals away from home against the Champions Route teams and a sizable 109 goals at home. These teams have only scored 26 home goals and 13 away. Half of the 34 Champions Route teams failed to score in both the home and away match against the top seed.   
 
  • Commonly, there is a four goal difference between the top and bottom seed in a qualifier. Many examples exist: Barcelona 7-0 Celtic, Bayern Munich 5-0 Dinamo Zagreb, Real 8-0 Malmö FF, Maccabi Tel Aviv 0-4 Chelsea (both home and away), Chelsea 6-0 Maribor, Athletico 5-0 Malmö FF, APOEL 0-4 Barcalona, Real Madrid 4-0 Ludogorets Razgrad, Porto 6-0 BATE Borisov, Athletic 4-0 Austria Wien, Bayern Munich 5-0 Viktoria Plzeň, Barcelona 6-1 Celtic, Steaua București 0-4 Cheslea, Chelsea 5-0 Genk, Dinamo Zagreb 2-6 Real Madrid, Viktoria Plzeň 0-4 Barcelona.

While looking at Champions League groups before the changes still suggests to Pot 4 seeds are the least likely to qualify (and the odd trashing still happens), the variation within groups regarding team quality doesn’t appear to be as great.  Maybe it is worth it for the money of maybe it’s time for UEFA to start re-thinking things.

The Premier League 25 Years On

11/8/2017

 
By David Butler

With the Premier League beginning its 25th season tonight, its interesting to think about the evolution of the competition since 1992. Off the pitch, the economic growth of the industry, embodied by wage increases, transfer fee inflation, broadcast rights sales and the successful commercialisation of the ‘product’ stands out as the major development.

On the pitch, the internationalisation of the league is the most notable structural change for me. The influx of foreign talent has largely been a product of the Bosman ruling and the increasing wages on offer in the League. Notably, the increasing numbers of overseas players in the Premier League has been a controversial issue.

The charts below give an indication of the internationalisation of the Premier League over the last 25 years. The data for these charts has been gathered from multiple online sources and constitutes 15,162 individual observations.

The first chart displays the nationality of Premier League players in percentage terms by season based on whether they are English (white bars), from another EU country (light grey bars) or are non-EU (dark grey bars). In 1992, the majority of the talent in the league was from England.  Only 35% of the players for the 17/18 season are English. This is the joint lowest percentage in the history of the competition and the share of English born player in the league has fallen over the past 25 years.
Picture
As the Republic of Ireland, Northern Ireland, Scotland and Wales have had a strong connection to the Premier League over the years, the second chart shows the declining number of players  from the British Isles and Republic of Ireland playing in the league over the years. In 92/93 there was 541 players from the British Isles and the Republic of Ireland. This season there are 244 players from the region. Along with some seasons in the mid 2000’s, the last two seasons stand-out as more players from outside of the British Isles and Republic of Ireland region were contracted to Premier League Clubs.
Picture
The third chart is a count of the number of nationalities in the league over the years.  In 1992 there was 30 countries represented in the Premier League. There will be 65 represented this year. Armenia (Henrikh Mkhitaryan) were the newest arrival last season.
Picture

Career Paths After Football

8/2/2017

 
By David Butler

Former Liverpool and France striker Djibril Cisse retired from football yesterday in order to focus on a career as a DJ and producer. He also aims to develop his clothing brand. Cisse seems upbeat about finishing his career as a professional footballer. That may be in contrast to many others who struggle to deal with the conclusion of their short but highly lucrative careers as footballers. Pro careers usually conclude by a players mid-thirties. The end of a period of significant remuneration or celebrity status may have negative mental health effects when finishing up. 

The pie chart below displays the post-football career paths of 142 players contracted to Arsenal, Chelsea, Liverpool, Manchester United and Tottenham Hotspur for the 2000-2001 Premier League Season. While this is somewhat of a biased sample (as these are elite clubs), information was accessible on many of the players. Importantly, the bulk of the sample have since retired. The data is solely reliant on Wikipedia entries that provide qualitative information on life after football. 
Picture
A significant proportion managed to stay within the game as coaches (the most common career path), assistant managers or managers. Some hold ambassadorial roles with clubs or administrative/director positions. Naturally, there is a variation in the stature of the clubs these roles are held with. 15% of the sample went into TV and broadcasting, primarily in the role of pundit. Lots of players hang on in there too, refusing to leave age stop them from playing – several of those still playing late in their thirties are registered back with their boyhood clubs. Many elite players truly go full circle. Perhaps they just love football. Maybe they smoothed their consumption when on highly paid contracts, not requiring a new income stream now? 

While I’m sure plenty of these ex-footballer have private business interests, very few players attempted to retrain. Some interesting stories do exist for the sample of players. Sol Campbell and Michael Stewart have sought careers in politics. John Halls entered the male fashion business. Frank Leboeuf has tried his hand at acting and Fabien Barthez began a career in motorsport in 2008. Michael Owen's story is more well known; he has become a successful racehorse owner and breeder. Perhaps the most interesting one of all is about ex-Liverpool full back Vegard Heggem who returned to Norway to work in the Salmon Fishing Business. Bad outcomes are seen too. Ronnie Wallwork was sentenced to 15 months in prison in 2011 and, in the same year, Celestine Babayaro was declared bankrupt.  
​
It will be interesting to see how this trend moves given the substantial salary increases seen in the sport, even since the 2000-2001 season. Thinking about these ideas reminds me of the story of Neil Webb, the England international and former Manchester United and Nottingham Forrest player. Webb became a postman after retirement. Many other top Premier League players of that era are also known for sourcing income from after dinner speaking. That generation were not part of the 'crazy money'. Such events may become a thing of the past.

On the Managerial Merry-Go-Round

16/1/2017

 
 By David Butler

The Christmas period saw three struggling Premier League clubs part company with their manager. Alan Pardew, Bob Bradley and Mike Phelan were all sacked. On top of that Gary Rowett, Jimmy Floyd Hasselbaink, Gary Caldwell and Walter Zenga were also relieved of their duties in the Championship. This is a topic that often crops up around this time of year.

While pre-season is the most common time for managerial departures in English football, performing well in the first half of the season seems key to hanging on to a managerial post. Failing to perform in earlier rounds of the football calendar appears to create panic for owners.

The timing of a sacking appears important to owners for two general reasons.  On the pitch, a replacement manager needs  time to turn things around and put his stamp on a new team in terms of playing style and strategy. Off the pitch, owners face the difficult decision of trusting an apparently under-performing manager through the January transfer window. If owners are investing significant resources in playing talent during the January window, in an effort to avoid relegation, they may not have faith in the incumbent. They may prefer to give a fresh face the resources if they believe the current set-up squandered a transfer kitty in the previous window(s).

Looking at the last number of seasons, six out of the nine managers sacked during the 2013/14 campaign (‘mutual consent’ is considered sacking) were released between 1st of December and the 14th of February. Five out of six sackings occurred between the 27th of December and the 11th of February in the 2014/15 season. Last season was somewhat different with only Gary Monk and Jose Mourinho sacked in December. Newcastle and Aston Villa let Steve McLaren and Remi Garde go in March but it proved too late. This season Francesco Guidolin only reached the 3rd of October, while Pardew, Bradley and Phelan were all let go in December and January respectively.

But does changing the manager matter? Some of the most recent evidence suggests that firing a coach can generate improved performances but that the effects differ across leagues. Sacking may not be as trivial as the media suggests. A slight increase in points can be accrued, whether this is enough to avoid relegation is another matter.            

Boxing PPV and (Un)certain Outcomes

9/12/2016

 
By David Butler

In the last post on this website Robbie discussed how uncertainty of outcome is often what drives interest in sport. As he said “contests where the outcome is predictable are often criticised for being boring”. He also notes that “some might argue that watching a dominant champion can increase interest in a sport”. At times people enjoy watching a champion or a well-known star as much as a close contest.

Looking at the betting for this weekend’s big boxing fight made me think about this a little more. The betting on the Anthony Joshua v Eric Molina fight currently stands at Joshua 1/50 to win. Molina is 14/1 to succeed and a draw is 50/1. Why would customers pay £16.95/€21.95 for what the markets suggest is a foregone conclusion?

When it comes to major boxing matches, uncertainty of outcome rarely seems to influence promoters or those buying the product. The list below shows the average odds for HBO fights in 2016. HBO serves as a distributor of major boxing events for pay-per-view. A clear favorite has existed in almost all of the bouts with the exception of the Sergey Kovalev vs. Andre Ward and Manny Pacquiao vs. Timothy Bradley fights. In all cases the favourite has won (marked in blue below).
Picture
While the data for subscribers by fight is a little patchier, the relationship between uncertain outcomes and demand seems spurious.  From this list, the fight the market priced as the closest contest , Sergey Kovalev vs. Andre Ward, had a reported 160,000 buyers. The fights such as Canelo Alvarez vs. Liam Smith and Canelo Alvarez vs. Amir Khan had 300,000 and 600,000 subscribers respectively.

Naturally, this raises the question of why people shell out cash to view outcomes that are hardly uncertain. Many reasons might exist. Maybe viewers enjoy seeing a dominant champion succeed? Many of the headlines after these bouts use the words 'demolish' or 'crush' to describe the fight. Maybe nationalism is a factor? The Mexicans tune in to see Alvarez and the British follow Khan. Maybe viewers rarely get to see certain fighters or it could be close to the end for one star? Maybe the major broadcasting firms and promoters just do a great marketing job?  Maybe fans are risk averse and just don't want to miss what could be a major upset in boxing history?  Maybe viewers just don't want to feel out of the loop in the coffee room on Monday morning. The list could go on...

Relegation & Attendance

19/10/2016

 
By David Butler
​
As the years go on, a growing number of English clubs are experiencing the Premier League. For many, this experience is short lived. Watching highlights from the Championship on Sky Sports this morning, I saw goals go in at Barnsley, Birmingham, Fulham, Blackburn and Leeds. As a Tottenham fan my mind naturally cast back to matches at the recognisable grounds. David Ginola’s goal in 1999 at Oakwell in the FA Cup is a pretty salient memory. Robbie Keane’s second of the game in 2006 at St. Andrews is another.  Equally, I remember losing at Craven Cottage, Ewood Park and Elland Road. What struck me most was the attendance last night, or more precisely, lack of it, at these grounds. Albeit a Tuesday night, the array of empty seat at the venues (in particular Portman Road) were blatantly obvious.  I don’t have many memories of this for these clubs in the Premier League.

To consider this idea quickly and crudely (as all other factors are being held equal), the graph below shows the average home attendance figures for a series of clubs that spent at least two consecutive seasons in the Premier League (blue bars) and were subsequently relegated to Division 1/The Championship for up to three seasons* (grey bars). Most of the data is taken from European-Football-Statistics website. I focused on current Championship clubs and left out some notable yo-yo teams such as Norwich, Newcastle and QPR.

As you would expect the graph illustrates the considerable attendance drop for many clubs when they leave the top flight. Ipswich were the only ones to maintain and increase their attendance after relegation from the Premier League. This may be due to the fact that, despite their relegation, they still qualified for the UEFA Cup through the Fair Play mechanism for the following season.

​For some clubs there seems to be a natural decay too. When a return to the Premier League is not secured immediately, attendance will suffer further; as was the case with Birmingham, Reading, Leeds, Wolves and Wigan.  
Picture
​It’s also interesting to think about attendance in terms of the capacity of the ground. This is obviously important and absolute figures can only give us so much of an insight. The table below shows the attendance ratio for the clubs listed in the graph above. Reading and Fulham had almost a full house while in the Premier League. This ended after relegation. Leeds were also quite close to capacity before their collapse. Blackburn observed the biggest fall, a 24.08% drop after relegation.  Birmingham also witnessed a high fall following relegation (21.11% drop).

*Wigan and Wolves were relegated to League One in year two for Wolves and year three for Wigan
Picture
<<Previous

    Archives

    February 2023
    January 2023
    December 2022
    November 2022
    October 2022
    September 2022
    August 2022
    July 2022
    June 2022
    May 2022
    April 2022
    March 2022
    February 2022
    January 2022
    December 2021
    November 2021
    October 2021
    September 2021
    August 2021
    July 2021
    June 2021
    May 2021
    April 2021
    March 2021
    February 2021
    January 2021
    December 2020
    November 2020
    October 2020
    September 2020
    August 2020
    July 2020
    June 2020
    May 2020
    April 2020
    March 2020
    February 2020
    January 2020
    December 2019
    November 2019
    October 2019
    September 2019
    August 2019
    June 2019
    May 2019
    April 2019
    March 2019
    February 2019
    January 2019
    December 2018
    November 2018
    October 2018
    September 2018
    August 2018
    July 2018
    June 2018
    May 2018
    April 2018
    March 2018
    February 2018
    January 2018
    December 2017
    November 2017
    October 2017
    September 2017
    August 2017
    July 2017
    June 2017
    May 2017
    April 2017
    March 2017
    February 2017
    January 2017
    December 2016
    November 2016
    October 2016
    September 2016
    August 2016
    July 2016
    June 2016
    May 2016
    April 2016
    March 2016
    February 2016
    January 2016
    December 2015
    November 2015
    October 2015
    September 2015
    August 2015
    July 2015
    June 2015
    May 2015
    April 2015
    March 2015
    February 2015
    January 2015
    December 2014
    November 2014
    October 2014
    September 2014
    August 2014
    July 2014
    June 2014
    May 2014
    April 2014
    March 2014
    February 2014
    January 2014
    December 2013
    November 2013
    October 2013
    September 2013
    August 2013
    July 2013

    About

    This website was founded in July 2013.

    RSS Feed

    Categories

    All
    American Football
    Athletics
    Baseball
    Basketball
    Behavioural Economics
    Boxing
    Broadcasting
    Competitive Balance
    Cricket
    Cycling
    Darts
    David Butler
    Declan Jordan
    Drugs
    Ed Valentine
    Epl
    Esports
    Expenditure
    F1
    Fifa World Cup
    Finances
    Funding
    Gaa
    Gaelic Games
    Gambling
    Game Theory
    Gary Burns
    Geography
    Golf
    Greyhound Racing
    Guest Posts
    Horse Racing
    Impact Studies
    John Considine
    John Eakins
    League Of Ireland
    Location
    Media
    Mls
    Mma
    Olympics
    Participation
    Paul O'Sullivan
    Premier League
    Regulation
    Research
    Robbie Butler
    Rugby
    Simpsonomics
    Snooker
    Soccer
    Spatial Analysis
    Sporting Bodies
    Stephen Brosnan
    Swimming
    Taxation
    Teaching
    Technology
    Tennis
    Transfers
    Uefa
    Ufc
    World Cup
    Wwe

Related

The website is not formally affiliated to any institution and all of the entries represent the personal views and opinions of an individual contributor. The website operates on a not-for-profit basis. For this reason we decline all advertisement opportunities. 

Contact

To contact us email sportseconomics2013@gmail.com or find us on Twitter @SportEcon.