The Economics of Sport
  • Sports Economics
  • About
  • Workshop
  • Selected Publications
  • Book Reviews
  • A Primer on Gaelic Games
  • Upcoming Events
  • Media
  • Education
  • Resources & Links

Latest Ireland U-19 & U-21 Squads - Relative Age

18/3/2015

 
By David Butler

Last Wednesday Noel King, Head Coach of the Irish U-21 international team, announced his squad for the first fixture of 2017 UEFA European Under-21 Championship qualifiers.  Ireland U-21's will take on Andorra on the 26th of March in the Regional Sports Centre in Waterford.  The squad is available here. Paul Doolin, Head Coach of the Irish U-19 international team also announced his squad for the forthcoming UEFA U19 Championships Elite Qualifying Round. The U-19's will take on Czech Republic and Slovakia in Germany later this month. This squad is available here.

Over the past years, I have conducted research on Relative Age Effects in Irish soccer.  A Relative Age Effect in sport occurs when there is a selection bias towards those born earlier in a registration period. Due to physical, psychological and social advantages older children in a cohort are more likely to be identified as talented, with the upshot being a skewed birth distribution of elite performers in youth sports.

In the case of soccer, as is with many other sports, a higher proportion of children born in the first quarter of the calendar year represent their country at an elite level - for the duration of their time as a youth player they compete against relatively younger children, benefitting from early maturation.

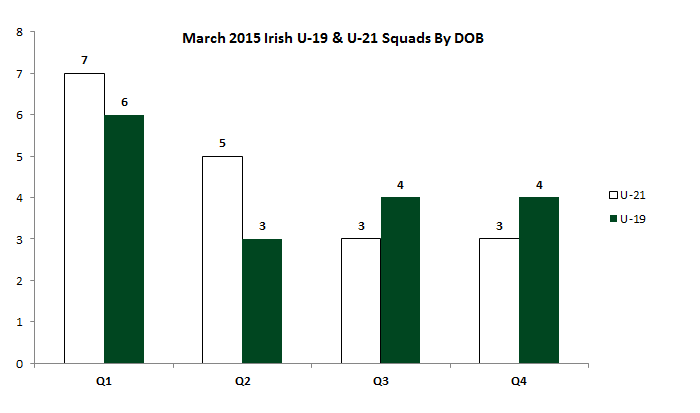
Below is the distribution of date of births for our latest U-19 and U-21 squads.  Q1 refers to January to March Births, Q2 from April to June and so on.  For both squads most of the selected players are born from January to March. 5 of the U-21 players are born in January (approx. 30% of the squad). Two thirds of the U-21 squad are born in the first half of the calendar year. Relative age issues do however seem to be less prevalent in the U-19 squad.

Food for thought for those watching on in Waterford later this month.   

Picture

Chelsea F.C. and the Chicago School of Economics

17/3/2015

 
By John Considine
Picture
In some quarters Chelsea F.C. is seen as a prime example of "what is wrong with football".  In other quarters the Chicago School of Economics is seen as the prime example of "what is wrong with economics".  Both claims are exaggerated.  However, it would not be unfair to say that the criticism of both Chelsea and Chicago is that their perspective is probably too narrow.

Chelsea F.C. were knocked out of the Champions League last Wednesday.  Chelsea had drawn 1-1 with Paris Saint Germain (PSG) in the first leg in Paris.  In the second leg, their opponents were reduced to 10 men after the star player, Zlatan Ibrahimovic, was sent off for a challenge on Oscar.  Immediately following the challenge it seemed that the remaining outfield Chelsea players surrounded the referee and put pressure on him to issue a red card.  Prior to the game the Chelsea manager, Jose Mourino, had claimed that PSG were aggressive in their approach.  When Chelsea lost, some TV pundits suggested that it was footballing karma.  Some expressed their delight at the result.  Others criticised what they felt was Chelsea's gamesmanship.

The Chelsea manager took two of the pundits to task.  Mourino wondered aloud if Jamie Carragher and Graham Souness forgot how they themselves had played the game (media reports of his response can be found here and here).  Mourino has a point.  As players, both Souness and Carragher tended to do what was in the interests of their team rather that what was in the interest of the wider game of football.  But that was as players.  It is here we can turn to the father of the (old) Chicago School of Economics - Frank Knight.  Knight liked to use sport as a metaphor in his work.  And, when it came to the driving force of humans as players in a game he said "It is just as in a game where the concrete objective - capturing our opponents' pieces, carrying a ball across a mark, or whatever it may be - is a matter of accident, but to achieve it is for the moment the end and aim of being".  While not all players will 'stop at nothing' to win a game, many will break, and most will bend, the rules to ensure victory.

Knight agreed (with Ruskin) that success in the game of business went to the "industrious, resolute, proud, covetous, prompt, methodological, sensible".  Successful athletes and sports teams, like Chelsea, have many of these qualities.  Knight's list for business success also included "unimaginative, insensitive, and ignorant".

The father of the Chicago School of Economics drew more heavily on the sporting metaphor when he was writing about economics and ethics.  In "The Ethics of Competition" he discusses the qualities of a good "game" and why business does not represent a good game.  In "Economic Theory and Nationalism" he extends the metaphor to politics.  Probably his most comprehensive use of the metaphor of sport is presented in a 1939 essay spread across three issues of Economica.  The overall title of the three papers is "Ethics and Economic Reform".  In this work, Knight separates the actions of individuals as players at a particular moment in time from those individuals charged with protecting the wider game of politics, business, or sport.  Mourino is missing the point when he says Souness and Carragher played in a particular fashion.

Nobel prize winner James M. Buchanan claims that the "new" Chicago School of Economics forgot some of the lessons of Knight and his colleagues.  His thoughts on the subject are captured in a series of presentations made in the University of Rochester and available on YouTube (here and here).  In particular, he points out the problems of using an efficient market hypothesis when it comes to the issue of public goods.  He could probably have added that modern economists could read Knight for an understanding of the role of economics in the wider social game.

[Those interested in a more detailed account of Knight's uses of the sport metaphor should consult Ross Emmett's book pictured above.]

Is the Grass Greener On the Other Side?

16/3/2015

 
Picture
By Stephen Brosnan

Recently, I watched on as Cesc Fabregas lined out for Chelsea against Tottenham Hotspurs in the Carling Cup final. The story is all too familiar to long suffering Arsenal fans. Pluck a relatively unknown player from the continent (or anyone from the Barcelona academy), make them a star, only to watch them leave citing aspirations of moving on to bigger and better things (again, Barcelona being a common destination). Another thing which caught my attention was the notable exclusion of another former Gunner plying his trade, albeit sporadically, at Tottenham. Emmanuel Adebayor left in search of bigger and better things yet now finds himself in the footballing wilderness, not wanted by his club and seemingly not worth the risk (or money) for anyone else. All this got me thinking about the age old adage: Is the grass really greener on the other side?

Player performance has been analysed using (i) Starts per substitute appearance (S-P-S) and (ii) Goals to games ratio (G-P-G) and (iii) Differences in market value for the ten most expensive transfers out of Arsenal to determine the success of players at their new clubs following their departure from North London

Picture
Column 3 and 4 show players starts per substitute appearance during their time at Arsenal and their new club while column six shows the difference between the two periods. On average, players started 5.93 games less per substitute appearance at their new clubs compared to their time at Arsenal. Of all the players included only Robin Van Persie has increased his starts per substitute appearance, more than doubling his starts per sub appearance from a sub appearance every 2.21 games at Arsenal to 5.5 games at Man United.

Column 7, 8 and 9 show the goals per game ratio of players during their time at Arsenal and at their new clubs. On average, players goals per game ratio has fallen by 6% since leaving Arsenal with Thierry Henry (-26%) and Marc Overmars (-19%) the biggest drop after moves to Barcelona.  Again, Robin Van Persie proves the exception to the rule with his goals per game ratio increasing by 13% at Old Trafford.

It is evident that with few exceptions most players have performed significantly worse after leaving Arsenal compared to their time in North London. Robin Van Persie is the only player to have improved his performance dramatically since his time at Arsenal and given his recent injury worries, as well as United’s loss of form in the last few seasons, it is not inconceivable that he will follow the trend of many of his illustrious predecessors who despite leaving in search bigger and better things quickly realised that the grass is not always greener on the other side.


Stephan Brosnan is a research assistant working in the Department of Economics at University College Cork. 

Mark Lawrenson and System 1 biases

11/3/2015

 
By John Eakins

I had a recent conversation with David Butler in relation to his post on pundit predictions on English Premier League games. As we got talking about the predictions, David made a particular observation that very few 0-0 draws were predicted by the pundits that he looked at. We thought that this was interesting as behavioural economics could be used to explain this phenomenon.  It could be argued that individuals have a tendency toward a ‘something will happen’ prediction bias (this is my own made up name – I think Dave has a more technical term for it!). That is, when you are asked to predict a football score in particular, it is more often the case that an individual will predict that something will happen rather than nothing will happen.  The automatic or impulsive part of your brain (System 1) works against the reflective or controlled part of your brain (System 2) and comes up with predictions which are not rational given what has happened in the past. Perhaps people think that predicting that the status quo will hold is in some senses, not considered to be a prediction.

I pointed out to him that Mark Lawrenson also does Premier League predictions in his role as a pundit for the BBC so our conversation ended with my proposal to analyse his predictions against the actual outcomes and see whether there is evidence of a bias. As an expert we might expect Lawrenson to rely more on the reflective or controlled part of his brain, he knows that 0-0 draws occur more often than what a non-expert might think. Or maybe not. I used data from the current English Premier League season covering matches up to last weekend (7th March 2015, Total Games = 279). The following figure plots the distribution of actual scores against Lawrenson’s predictions. One can see that the distribution of actual scores is a lot more random that the distribution of predictions.  Lawrenson has a particular tendency to pick 2-0, 2-1, 1-1 and 0-2 as final scores.

Picture
But what about the ‘something will happen’ prediction bias specifically? There have been 22 nil-nil draws so far in the Premier League and Lawrenson has (so far) predicted zero nil-nil draws. Obviously this is only one person/pundit but the fact that there is such a big difference between the actual and the predicted and the fact that Lawrenson has not even predicted one nil-nil draw is I think reasonably strong evidence to support the ‘something will happen’ prediction bias.

I have made some other calculations in the below table. Lawrenson also predicts more home wins that what has actually happened, conversely less away wins and less draws. His predictions have also never involved a game with more than 4 goals despite that fact that 26 of these games have occurred so far in the Premier League. Finally he has a tendency to over predict wins by small margins (2 goals or less).


Picture
It is perhaps unfair to single out Lawrenson’s predictions, my point is that other pundits and people in general are likely to suffer from these biases as well. David might look at the data he has on Paul Merson’s predictions. And I will revisit Lawrenson’s predictions at the end of season to see if he continues to display the same biases.

Efficient Market Hypothesis & The Cheltenham Festival 2015

9/3/2015

 
Picture
By Fiona Mullins & Robbie Butler

This week is naturally all about horse racing. The Cheltenham Festival kicks off tomorrow and we are again attempting to ‘beat the market’. This will be our seventh attempt at challenging the Efficient Market Hypothesis and over the course of the next five days we will place 27 imaginary wagers to see if it is possible to beat the bookies.

The scorecard reads 3 – 3 since 2009 – with the market beaten in 2010, 2011 and 2013. We hope to improve on last year’s performance, when an overall loss of €8 was reported.

To recap on what we are doing, the logic (and economics) behind this annual test is grounded in the pioneering work of Professor Eugene Fama. Fama’s publication "Efficient Capital Markets: A Review of Theory and Empirical Work" appeared in the May 1970 issue of the Journal of Finance and conceptualized the efficient market hypothesis (EMH). Put simply, Fama concluded it was not possible to ‘beat the market’. Fama was awarded a Nobel Prize in 2013 for his ground-breaking work, essentially demonstrating that markets quickly take account of new information and cannot systematically be beaten. 

In previous years I have selected horses to bet on. This year we are simply going to follow the favourite to see if we can beat the market this way. We will place a €2 win bet in each race if the horse is less than 4-1, and €1 each-way bet if the horse is 4-1 or greater. Daily updates to follow.


Day 1
Day 1 proved to be fruitful. Three favourites won and another was placed at 6-1. Annie Power’s fall at the last, when clear, was very unfortunate. Total stake was €14. Returns as follows:

Douvan €2 at 2/1 = €6
Un De Sceaux €2 at 4/6 = €3.33
Faugheen €2 at 4/5 = €3.60
Thomas Crapper €1 each way at 6/1 = €2.50

Total return: €15.13. 
Profit (Day 1): €1.13
Total Profit: €1.13

***************************************************************************************************************************************************
Day 2
Day 2  was another decent day for favourite backers. Two winners and a placed horse saw us collected from three of the seven races that went to post. Again a total stake of €14 with returns below:

Don Poli €2 at 13/8 = €5.25
Activial €1 each way at 17/2 = €3.13
Moon Racer €1 each way at 9/2 = €7.63

Total return: €16.01
Profit (Day 2): €2.01
Total Profit: €3.14


***************************************************************************************************************************************************
Day 3
Day 3 proved to be much tougher than the two previous. Vautour got us off to a flyer winning at 6/4 but he was the only winning favourite of the day. We did have some each-way success but it was not enough to prevent a loss on the day. A stake of €12 yesterday with winnings as follows. 

Vautour €2 at 6/4 = €5
Saphir Du Rheu €1 each way at 5/1 = €2.25
Monetaire €1 each way at 11/2 = €2.38
Total return: €9.63
Loss (Day 3): €2.37
Total Profit: €0.77

Going into Day 4 we have a 1.925% return to show. Lets hope we can retain the profit come in the end of the day.

 
***************************************************************************************************************************************************
Day 4
The bookies finally got the better of us on the final day. While Peace and Co got us off to a flyer in the Triumph Hurdle we had to wait until the final race to collect again. Stake of €14. Returns as follows:

Pace and Co €2 win at 2/1 = €6
Ned Butline €1 each way at 4/1 = €2.
Total return: €8
Loss (Day 4) = €6
Total Loss: €5.23  

Fama wins again. 

Fiona Mullins is a second year Commerce student at University College Cork. Fiona has ridden winners at Clonmel, Naas and Tipperary. She is also a member of the stable staff at Willie Mullins yard in Co. Carlow.

Sports Participation and Location Concentration

7/3/2015

 
By Sean O'Connor

The recent release by the Central Statistics Office (CSO) of a rich variety of data has seen a number of blogs examining the makeup of Ireland’s participation levels in various different sporting activity.

Only last week Robbie Butler examined the gender and regional breakdown of a variety of sporting activity released through the Household Budget Survey’s Sports Module (link to the blog can be found here).

Although I wish to use some of the data analysed in the piece above, I will approach it from a different angle; that of examining the location quotients of sport participation within the various regions of Ireland. Location Quotients (LQ) are a measure utilised in Economic Geography which typically analyse the employment concentration of a given industry in a region relative to that of the national level. Below highlights the equation.

An LQ of 1 means that an industry represents the same share of local employment as the national economy average. An LQ > 1 indicates an industry is more concentrated in a specific geographic area than the national average.

One of the great things about these tools, is that they can be adapted in order to fit a specific need. So rather than focusing on employment, we can use the Location Quotient to determine what particular sports are concentrated in what regions of Ireland. Below illustrates the NUTS-3 breakdown of regions within Ireland.
Picture
1.      Border Region (Cavan, Donegal, Leitrim, Louth, Monaghan, Sligo)
2.      West Region (Mayo, Roscommon, Galway)
3.      Midlands Region (Laois, Longford, Offaly, Westmeath)
4.      Mid-East Region (Kildare, Meath, Wicklow)
5.      Dublin Region (Dun Laoghaire-Rathdown, Fingal, South Dublin & Dublin City)
6.      South-East Region (Carlow, Kilkenny, South Tipperary, Wexford, Waterford)
7.      South West Region (Kerry, Cork)
8.      Mid-West Region (Clare, North Tipperary, Limerick)

Table 1 below highlights the Location Quotients generated for Sports Participation levels by main sport participated in.

Picture
As mentioned previously a value greater than 1 indicates that sports participation is more concentrated in a particular region than Ireland as a whole. For instance, Cycling in the Midland region has a value of 1.4, indicating participation levels of Gaelic Football are 1.4 times more concentrated in the Midland region than Ireland as a whole.

Focusing on the team sports of Soccer, Gaelic Football, Hurling & camogie, and Rugby. Participation in Soccer is highly concentrated in Dublin, as well as the South-East. In fact, Soccer is more concentrated in the South-East than any other region. Although one might imagine Soccer participation to be more concentrated in the Dublin than the rest of the country, given the majority of our national players are born there, the high South East score is interesting, given one wouldn’t associate it with being a Soccer ‘hotspot’.  

The regions which make up the Border, Midlands, and West all have LQ scores greater than 1 in Gaelic Football, indicating a strong concentration in participation levels, relative to Ireland. Given some of the counties which make up these regions, Donegal and Mayo being the most prominent, it’s not difficult to imagine why participation levels may be more concentrated here.

Hurling & camogie scored an LQ above 1 in three regions. These are West (2.3), South-East (2.1), and Mid-West (2.3). Again, when one examines some of the counties to be found in these regions i.e. Galway, Kilkenny, Wexford, Waterford, Tipperary it’s not at all surprising at Hurling & Camogie’s high concentration of participation to be found here.

Finally, Rugby is highly concentrated in four regions in Ireland. The region which houses the home of Munster Rugby, Limerick City scored the highest LQ with 2.1. Once again a higher concentration was witnessed in the South-East that what one may have expected, given the counties which encompass it. It might also be surprising the low concentration levels found in Dublin, given its home to numerous rugby clubs.


Sean O'Connor is a currently working as a research assistant at the Department of Economics, University College Cork. 

High School Athletes and Academic Performance

6/3/2015

 
By John Considine
Picture
The Journal of Sports Economics has just published a fascinating article titled 'Do High School Athletes Get Better Grades During the Off-Season?'  The short answer is that 'it depends on the level at which they participate'.  If they participate at the varsity level then their grade point average (GPA) declines during the season in which they play sport.  However, if they play at the junior varsity level then the GPA will increase.  In both cases the change in the GPA is relatively small.

One of the reasons the article adds to our knowledge of the relationship between participation in sport and the academic performance of student athletes is that the author, Katie Schultz, has data on individual athletes.  This allows her to employ a basic but powerful test of the impact of sporting participation.  There are 5,580 athletes in her data set.  However, her attention is primarily on about 50% of the full sample.  She examines those athletes who play one sport in one season.  (Her statistical tests reveal that there is no sample selection issue in this approach.)  Her data means she can look at an individual athlete and compare their performance when they were involved in sport with their academic performance during their off-season.  And, she can do this for over 2,000 athletes.

Schultz also conducts her analysis for various decompositions of the GPA.  For example, she examines the relationship between in-season and off-season for the core GPA (Maths, Science, English and History).  She also examines the relationship using the maths/science part of the core and the English/history part of the core separately.  It is in this latter decomposition that she finds that it is the English/history GPA is the primary channel for single-sport athletes performing below their best.  Schultz argues that this might be the result of English/history requiring greater time (due to the way they are delivered and assessed).  The maths/science GPA core improves for single-sport athletes during the in-season.

Those who take the time to read the Schultz paper will find that it also explores the relationship between sporting participation and the choice of non-core subjects.  They might also enjoy the way she establishes the softer/easier subjects.

Finally, it is worth noting that Schultz finds that "being an athlete corresponds to obtaining a 0.49 point higher GPA compared to a nonathlete".  It is precisely because of findings like this that it is important to focus on the change in the academic performance of individual athletes where they are engaged in sport.  It is a paper well worth reading.

[I have previously posted on some aspects of the relationship between sport and academic performance in an Irish context here and here.]

How Sport Is Played In Ireland

5/3/2015

 
By Robbie Butler 

Last week I wrote about sports participation in Ireland using data from the Central Statistics Office (CSO). The piece (available here) proved quite popular. In light of this, here's some further analysis on just how we play sport in Ireland. Like my previous post, information on the thirteen categories identified by the CSO is used to illustrate the different dimensions to participation in Irish sport. An "Overall" category is also included. 

According to the CSO, sports/physical exercise participation can take four forms: 1. Informal/Casual, 2. Organised Activity (non-competitive), 3. Organised Competition and 4. Professional/Semi-professional. The data for the fourteen categories is presented below.
Picture
Firstly, focusing on the right-most bar one can see that 85% of 'All sports' in Ireland are played/engaged with in an informal or non-competitive manner. Swimming, cycling, athletics and keeping fit are the most popular informal or casual pursuits. 

Our native games, Gaelic Football and Hurling & Camogie, are more predominately played in a 'competitive' fashion. More than 80% of all hurling and almost 60% of all Gaelic Football are played in an organised competition. The GAA should probably attempt to find out why informal/casual and non-competitive forms of their games are not as popular as other sports. 

Soccer, tennis and golf are among the most balanced sports in terms of participation, when one excludes category 4. Soccer is mostly played in an informal or casual manner (41.2%), followed by non-competitive (29.7%) and then competitive soccer (28.9%). Just 0.2% of the sample of 254 reported that they received payment for playing soccer (lucky them!). 

Rugby is the most balanced when one includes the Professional/Semi-professional. The reported figure of 5.1% in the Professional/Semi-professional is the highest of any of the thirteen categories. The sport also seems to have an excellent blend of competitive and non-competitive players. A 56% to 44% split between non-competitive (Categories 1 and 2) and competitive (Categories 3 and 4), makes it the most balanced sport in the sample. The CSO do warn however that the sample of rugby players, at just 56, does subject their results "to a wide margin of error".

Yoga/Pilates and Dance are dominated by female participants. Organised competition is non-existent in Yoga/Pilates and virtually non-existent in Dance. In fact, one is more likely to be a professional. Both exercises are pursued mainly in an organised but non-competitive manner. The informal/casual Dance figures are very interesting. What does this include? Disco dance-floor moves?  

'Merse' vs. 'Fletch and Sav'

4/3/2015

 
By David Butler

On the 28th of August I began recording Sky Sports Pundit and ex-Premier League Footballer Paul Merson’s predictions for English Premier League fixtures.

Merse is not however the only soccer pundit  on T.V that predicts. At the weekend a friend introduced me to the 'Fletch and Sav' Matchday Live on BT sport. The hosts, Darren Fletcher and Robbie Savage, make regular predictions on English Premier League fixtures. They are joined by Michael Owen and Steve McManaman. I'm led to believe that these pundits do not predict every round of fixtures, unlike Merse.

Three of the four BT soccer pundits are ex-Premier League footballers too and taken together Merse, Owen, Macca and Sav have accumulated 186 senior international caps. They are pretty experienced to say the least and despite my affections for Tottenham Hotspur, I have many childhood memories of all four being top Premier League footballers, Michael Owen being the most obvious candidate. 

I managed to get access to 76 predictions for this season for Fletch, Sav, Macca and Owen. These were all for the same matches. I then compared the predictions of the BT pundits to that of Sky Sport's Paul Merson for those matches.  

In terms of predicting the outcome for the 76 matches Merse comes out on top. He outperforms all four BT predictors who get more match outcomes wrong then right. He is followed by Owen, McManaman and Savage (joint third) and finally Fletcher. Steve McManaman is best at picking the notoriously difficult 'correct scoreline'.

As a colleague mentioned to me earlier, I think its time the Economists take on the pundits - roll on Premier League 15/16'!


Picture
BT vs Sky

Show me the money! – The NFL and the multi-billion dollar TV deal

3/3/2015

 
By Pádraig MacConsaidín

A girl on a trapeze wire, dancing animals, iridescent sparklers and wondrous pyrotechnics; welcome to the greatest show on earth – Super Bowl XLIX. 114.4 million viewers tuned in across the globe to witness the showpiece event of the NFL season making it the most watched finale in history. The annual event, the jewel in the crown of the televised NFL calendar, but  surrounded by a cluster of equally lucrative gems in terms of TV value, brought to air by a money-spinning TV deal between the NFL and the major players in American network broadcasting.

The new broadcast deal, which came into effect for the 2014 season and runs through to 2022, saw the NFL renew its broadcast packages with the major networks; Fox, NBC and CBS. Under the agreement each of the networks will hold the rights to three Super Bowls, while NBC can now boast the addition of the prime-time Thanksgiving game to its schedule. Though the minutiae of the deal have not been revealed, it is anticipated the three networks will pay on average $3bn per annum, an estimated 60% increase on the annual fee they currently pay. The fourth major player in the NFL’s TV deal is ESPN, who have seen the annual cost of their stake in the rights increase to $1.9bn per annum. ESPN’s greater cost for rights is reflective of their exclusive retention of the prime-time Monday Night Football package, the highest rated midweek show on American cable television. 

These deals are independent of supplementary agreements the NFL holds with other media outlets, which nets them an additional $2bn in revenue every year. In advance of kick-off for the 2014 season, there was in the region of $7bn for NFL franchises to share between them from media money alone. This, before a season ticket went on release, merchandise hit the club shop, or a hot-dog and beer was consumed. Big money. High stakes. One of the principal reasons the networks are willing to invest so much in the NFL TV deals is because 97% of all sporting events are watched live. 

To appreciate the scale of the deals, and the audience the NFL reaches, Brad Adgate of Horizon Media has crunched the numbers from the raw data made available by the NFL and the networks up to and including the 2013 season. Here’s the math: 
Picture
Source : BBC
Picture
When the networks invest such a vast amount in TV deals they expect a return, by way of ratings which in turn allows them to sell air time for commercials. Though audience figures have been fluctuating in recent years, they are still up on viewership from the mid 00s as recent research by Nielsen in the Wall Street Journal has confirmed (reflected in the ‘Holding the Ball’ graph across up to 2013).

The exact figures for the individual networks, based on the 2013 data, would seem to indicate that NBC achieved the greater return for its investment, insofar as their average audience was greater than any other the other broadcasters. However, when the average audience per game and the number of games each network broadcasts are aggregated, Fox come out on top for the aggregate average audience for games in the 2013 season by virtue of audience share and the greater number of games broadcast. Under the new deal with the NFL, ESPN pays approximately twice as much the other networks, but if we examine the 2013 figures under the old agreement, ESPN was paying four times the rate of other networks when the aggregated audience figure was taken into account, as evidenced by the Horizon data below.

As alluded to, the viewership figures for live sporting events are immense, as are the costs associated with securing the rights. The broadcasters it seems are not afraid to speculate in order to accumulate, and accumulate they certainly do, with subscription fees for packages sold to cable networks promptly passed on to consumers. The NFL on TV doesn't come cheap, viewers should know, they’re paying for it.


Pádraig MacConsaidín holds a BSc Government degree from University College Cork and is the Department of Government, Richard Haslam - Graduate of the Year 2014.

<<Previous
Forward>>

    Archives

    October 2025
    September 2025
    August 2025
    July 2025
    June 2025
    May 2025
    April 2025
    March 2025
    February 2025
    January 2025
    December 2024
    November 2024
    October 2024
    September 2024
    August 2024
    July 2024
    June 2024
    May 2024
    April 2024
    March 2024
    February 2024
    January 2024
    December 2023
    November 2023
    October 2023
    September 2023
    August 2023
    July 2023
    June 2023
    May 2023
    April 2023
    March 2023
    February 2023
    January 2023
    December 2022
    November 2022
    October 2022
    September 2022
    August 2022
    July 2022
    June 2022
    May 2022
    April 2022
    March 2022
    February 2022
    January 2022
    December 2021
    November 2021
    October 2021
    September 2021
    August 2021
    July 2021
    June 2021
    May 2021
    April 2021
    March 2021
    February 2021
    January 2021
    December 2020
    November 2020
    October 2020
    September 2020
    August 2020
    July 2020
    June 2020
    May 2020
    April 2020
    March 2020
    February 2020
    January 2020
    December 2019
    November 2019
    October 2019
    September 2019
    August 2019
    June 2019
    May 2019
    April 2019
    March 2019
    February 2019
    January 2019
    December 2018
    November 2018
    October 2018
    September 2018
    August 2018
    July 2018
    June 2018
    May 2018
    April 2018
    March 2018
    February 2018
    January 2018
    December 2017
    November 2017
    October 2017
    September 2017
    August 2017
    July 2017
    June 2017
    May 2017
    April 2017
    March 2017
    February 2017
    January 2017
    December 2016
    November 2016
    October 2016
    September 2016
    August 2016
    July 2016
    June 2016
    May 2016
    April 2016
    March 2016
    February 2016
    January 2016
    December 2015
    November 2015
    October 2015
    September 2015
    August 2015
    July 2015
    June 2015
    May 2015
    April 2015
    March 2015
    February 2015
    January 2015
    December 2014
    November 2014
    October 2014
    September 2014
    August 2014
    July 2014
    June 2014
    May 2014
    April 2014
    March 2014
    February 2014
    January 2014
    December 2013
    November 2013
    October 2013
    September 2013
    August 2013
    July 2013

    About

    This website was founded in July 2013.

    RSS Feed

    Categories

    All
    American Football
    Athletics
    Baseball
    Basketball
    Behavioural Economics
    Boxing
    Broadcasting
    Competitive Balance
    Cricket
    Cycling
    Darts
    David Butler
    Declan Jordan
    Drugs
    Ed Valentine
    Epl
    Esports
    Expenditure
    F1
    Fifa World Cup
    Finances
    Funding
    Gaa
    Gaelic Games
    Gambling
    Game Theory
    Gary Burns
    Geography
    Golf
    Greyhound Racing
    Guest Posts
    Horse Racing
    Impact Studies
    John Considine
    John Eakins
    League Of Ireland
    Location
    Media
    Mls
    Mma
    Olympics
    Participation
    Paul O'Sullivan
    Premier League
    Regulation
    Research
    Robbie Butler
    Rugby
    Simpsonomics
    Snooker
    Soccer
    Spatial Analysis
    Sporting Bodies
    Stephen Brosnan
    Swimming
    Taxation
    Teaching
    Technology
    Tennis
    Transfers
    Uefa
    Ufc
    World Cup
    Wwe

Powered by Create your own unique website with customizable templates.