By John Considine 
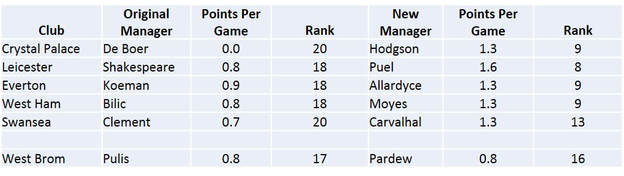
Last night Swansea, under their new manager Carlos Carvalhal, beat Arsenal. The win moved them out of the relegation zone. This is one piece of evidence that a managerial change produces an increase in points for a club. Broader evidence was produced two weeks ago on Sky's Monday Night Football. In the build-up to the Manchester United versus Stoke City game, Gary Neville and Jamie Carragher said that the evidence from the 2017-18 season suggests that there is a points bonus from changing the manager. The table below is a reproduction of what they used. Five of the six clubs listed improved their points per game under the new manager. 
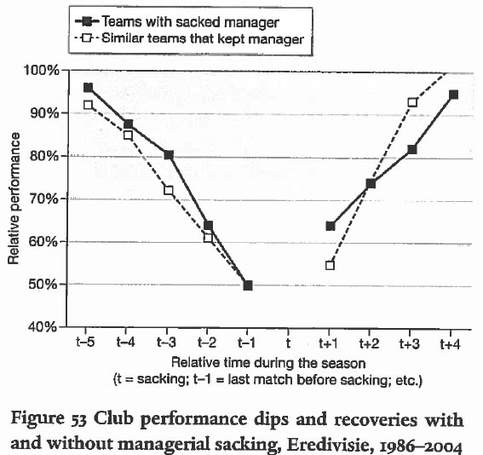
However, there is other evidence to contradict the above. The benefits of managerial change is viewed with scepticism by anyone who read The Numbers Game by Chris Anderson and David Sally. Anderson & Sally draw on work that examines the Dutch league for the period 1986 to 2004. Almost 20 years of data. The work confirms that the points accumulate by sacked managers, prior to their sacking, is unimpressive. It also confirms that the points accumulated by new managers increases. However, they argue that this is not the appropriate comparison. They argue that the appropriate comparison is between clubs who change their manager and those clubs who retain their manager despite a poor run of results. When such a comparison is made then replacing the manager is not the panacea some would claim. The data used by Anderson & Sally, as set out in Figure 53 from The Numbers Game, is reproduced below.
By Ed Valentine How many economists are there in the world? Or footballers? Or lawyers (some would say too many)? How many “new entrants” are there annually across these professions and make a solid career out of it over time? Of course, there is a greater chance of an individual becoming a lawyer or accountant than a high ranking professional tennis player. World number 531 Marta Kostyuk’s run to the 3rd round at the recent Australian Open generated notoriety for it’s rarity and got me thinking if there is a “regulars only” effect in professional tennis where breakthroughs into the lucrative top 100 are uncommon. Is it more likely that the number 531 ranked player in the women’s game can make the 3rd round of a Grand Slam tournament than it is in the men’s game? The analysis started with the assertion that in prize money terms about 100 male and 100 female players every 5 years (prime cycle) make a career out professional tennis. Sponsorship or endorsements have not been counted given that good players, who rank consistently highly attract these offers, where as those outside the top 100 do not command a media premium – Anna Kournikova may argue that however. This analysis was conducted from data covering 18 seasons from 2000 - 2017 using year end rankings as per the ATP (male) and WTA (female) rankings. Year end rankings were chosen for consistency purposes. At a basic level the data demonstrates that it is “easier” for a player to have a chance at launching a successful career in the WTA than in the ATP with 6% more female players making it into the top 100 at some point throughout the 18-year study. Whilst this represents more churn it does tell us that the opportunity to gain entry into a “career” status is greater. This is backed up by c13.5% more WTA players* making the year end top 100 just once than for those in the ATP. WTA players may not have stayed there due to the increase in competitive balance but they enjoyed the tournament privileges and chances to play in the more lucrative tournaments that come with the top 100 ranking. Interestingly the top 50 rankings saw the biggest gap between the WTA and ATP. This gap suggests that over the course of a career a WTA player can expect to play against more varied styles of opponent. This may be caused by the increase in Eastern European female players, enjoying brief success in the early part of their careers, only to be replaced by the very same in the years after.
While the odds for female players are better in terms of opportunity, almost a fifth of all of the players to have made the top 100 in both lists across the last 18 seasons appear once and have little chance of appearing there again. By David Butler
The 21st edition of the Deloitte Football Money League was released this week. Deloitte profile the highest earning clubs in football and assess relative financial performance. The chart on page two gives an insight to the composition of total revenue - broadcasting leads the way (45%) , followed by commercial revenues (38%) and then match day (17%). This broadcasting proportion has increased 6% from last year. Maybe this is good news for fans interested in keeping ticket prices down – namely, if broadcasting is the primary revenue source, keeping stadiums full may be a key goal for the clubs. A record ten English clubs are now in the top 20. This is largely down to the broadcast rights deal. Southampton are new in this top 20 list. Stability is forming with the top ten clubs remaining consistent in composition for the fourth consecutive year. AC Milan snuck in tenth back in 12/13. They are now outside the top 20. That said, with Tottenham’s home season at Wembley this year and their new stadium due to be completed for the start of next season this stability may be disrupted somewhat; there’s a 50m revenue gap they Spurs have to close on their Champions League opponents Juventus to break into the top 10. This probably won’t go unchallenged as Atlético Madrid (currently 13th) are also moving to a new stadium. Plenty to think about in the report and a must read for those interested in football finances. By John Eakins
A recent European Champions Cup between Munster and French rugby union club Racing 92 drew a lot of media attention, and not just because it was a crucial game in deciding who would progress to the quarter finals of the tournament. Much of the pre-match focus was also on the stadium in which the game took place, a newly opened multi-use domed stadium called the U Arena. Ronan O’ Gara, the former Munster player and now former Racing 92 coach, gave this description of the new stadium when writing in the Irish Examiner on the Friday before the Munster V Racing 92 match. “It’s hard for anyone who hasn’t experienced the inside of Racing’s new stadium to make a accurate judgment but believe me, they will be blown away when they walk in there Sunday. It’s not a retractable roof, so the sense of class and warmth will never be weather-dependent. It’s vast, and the finishings aren’t cheap, tacky, or cold. There is a vibe of quality off it and you are left to think to yourself: ‘And they play rugby in here?" As I was watching the game, I wondered about the increased prevalence of covered stadiums. I could think of a few off the top of my head including the Millennium stadium in Wales and a number of stadiums in the United States that stage American football games. According to Wikipedia, there are 67 covered stadiums (ones with a domed or retractable roof) in the world which cater for field sports (the Wiki page also includes covered stadiums which cater for tennis and other smaller scale sports but I’m focussing more on field sports here). Not surprisingly, the United States dominates the market with 7 of the top 10 covered stadiums by capacity located in that country. More generally, of the top 50 covered stadiums by capacity, 20 are located in North America (United States 17, Canada 3), 14 are located in Europe (Denmark 1, France 2, Germany 3, Kazakhstan 1, Netherlands 1, Poland 1, Romania 1, Russia 1, Sweden 2, Wales 1), 13 are located in Asia (Japan 10, China 2, Singapore 1), 2 in Australia and New Zealand (Australia 1, New Zealand 1) and 1 in South America (Brazil). In terms of field sports, the three which primarily use covered stadiums are American/Canadian football, baseball and football, with American/Canadian football mainly taking place in the much larger covered stadiums. 5 of the top 10 covered stadiums are currently being used by NFL teams. What is also interesting is when these stadiums were built. Of the top 50 covered stadiums by capacity, 33 were opened since 2000, 15 since 2010 and 11 in the last 5 years. Of those 11 stadiums built in the last five years, 6 are primarily used for football, 2 for the NFL, 1 for rugby, 1 for baseball and 1 a multipurpose venue. 3 have been opened in the United States, 6 have been opened in Europe, 1 in Asia (Singapore) and 1 in South America (Brazil). There are also a number of new stadiums, currently under construction, which will have either a domed roof or a retractable roof. These include the Lusail Iconic Stadium which is being built in Qatar for the 2022 FIFA World Cup, the Los Angeles Stadium at Hollywood Park in the United States which will serve as the home to the Los Angeles Rams and Los Angeles Chargers, the ANZ Stadium in Sydney, Australia and the Las Vegas Stadium in Las Vegas, United States which is been built for the Raiders NFL franchise. So are covered stadiums the way of the future? Not all proposed new stadiums will be covered (as can be verified in this list of future stadiums, also from Wikipedia) but the data above does suggest a gradual move towards modern covered stadiums. The question that arises is why is there a move towards modern covered stadiums. The fan experience is obviously an important consideration. Eliminating the uncertainty that the weather provides should have a positive effect on attendance as well as the spectacle that the game provides (although there is a counter argument that uncertainty is a good thing from a fans perspective). Possibly a more important reason however is having a venue which can cater for a number of different events and not just sports. Going back to the U Arena, it can cater for concerts and other indoor sports using moveable seating and stands. Ensuring an additional revenue stream from these types of events is thus an important consideration. In fact, one can see that Europe (in particular) is following the lead of the United States in building large multipurpose event centres which are active all year round and not just for the sports season. By Robbie Butler
A number of weeks ago the Irish Labour Court rejected an appeal by Ballydoyle Racing Stables, which attempted to prevent changes to the categorisation of its employees. The stable's failure in the Labour Court could have a significant impact on horse racing in this country. For those unfamiliar with the case here is a brief summary. Employees of the horse racing industry in Ireland have historically been deemed to be “agricultural workers”. According to 2010 Employee Regulation Order covering this sector, an agricultural worker is defined as: “a person employed under a contract of service or apprenticeship whose work under the contract is or includes work in agriculture, but does not mean a person whose work under such contract is mainly domestic service”. Importantly, this means that such workers can be asked to engage in: “a wide variety of activities, which are weather dependant, seasonal, unpredictable and often require 7 day week flexible working arrangements”. In 2015, the Irish Workplace Relations Commission (WRC) changed legislation covering the horse racing industry so that employees were no longer classified as “agricultural workers”. This has had serious consequences for the number of hours and days employees could be asked to work without a break. On a routine inspect of Ballydoyle stables, the home of many world famous Aidan O’Brien trained horses in May 2016, the WRC found the employers to be in breach of the law. Ballydoyle’s failure to overturn the ruling in the Labour Court has left the industry at a crossroads. A further appeal to the High Court is possible, and if successful, could result in a return to the status quo. It is worth pointing out that the definition of “Agriculture” under the 2010 Order is as follows: ““Agriculture” means horticulture, the production of any consumable produce, which is grown for sale or for consumption or other use, dairy farming, poultry farming, the use of land as grazing, meadow or pasture land or orchard or osier land or woodland, or for market gardens, private gardens, nursery grounds or sports grounds, the caring for or the rearing or training of animals and any other incidental activities connected with agriculture”. It is also worth pointing out, that Irish Government support for the horse racing industry has, since 2011, been provided by the Department of Agriculture. By David Butler
The growth of the Premier League and European football since the turn of the century seems to have worn the gloss off the FA Cup for fans of elite clubs. From time-to-time ‘the magic of the cup’ is revived – the 94th minute equaliser of Jamal Lewis being a timely reminder last Wednesday. These moments are rare however and typically two teams from the top level of English football reach the FA cup final. Millwall and Cardiff are the only two teams from outside the top flight to make the final this century and the last second tier team to win the competition was West Ham. Trevor Brooking gave the Hammers a 1-0 win against Arsenal in the 1980 final. Given the progress of the Premier League, I wonder will this ever happen again. The economic value associated with avoiding relegation from the Premier League or earning a Champions League spot, has resulted in managers prioritising league ambitions, often resting key players for Cup matches. This makes economic sense for the elite as, over time, the sums associated with Premier League success have dwarfed FA Cup payments. The payments for this year’s competition are below: Extra preliminary round winners (185) - £1,500 Preliminary round winners (160) - £1,925 First round qualifying winners (116) - £3,000 Second Round Qualifying winners (80) - £4,500 Third Round Qualifying winners (40) - £7,500 Fourth Round Qualifying winners (32) - £12,500 First Round Proper winners (40) - £18,000 Second Round Proper winners (20) - £27,000 Third Round Proper winners (32) - £67,500 Fourth Round Proper winners (16) - £90,000 Fifth Round Proper winners (8) - £180,000 Quarter-Final winners (4) -£360,000 Semi-Final winners (2) -£900,000 Semi-Final losers (2) -£450,000 Final runners-up (1) - £900,000 Final winners (1) - £1,800,000 Of course, there is another side to this. For smaller clubs a draw against a Premier League team can lead to a windfall and a good cup run can be very lucrative. The last 32 is decided next weekend with two David vs. Goliath clashes. Newport County AFC take on Tottenham Hotspur and Yeovil Town play Manchester United. The competition rules state that “matches played in the Third, Fourth, Fifth Rounds and Quarter-Final of the Competition Proper, the net gate receipts of each match shall be divided as follows: 45% to each Club competing in the match. 10% to the Pool.” Newport County ground Rodney Parade has a capacity of 7,850 (and the club are trying to install additional seats). Yeovil town’s Huish Park has a capacity of 9,565 (5,212 seated). Surely both will be full houses and both clubs can also expect their revenues to be boosted by TV money. As the old joke goes, the board of directors of these minnows may prefer a draw to scooping the £90,000 for winning the tie. If either Yeovil or Newport do achieve a draw, the economic value of a replay should not be understated. Although the take of gate revenue is lower for replays (42.5% to each Club), this would represent a major windfall. Here’s some very very casual estimates -Tottenham attracted 47,527 fans to Wembley to watch Tottenham vs. AFC Wimbledon in round three. If the same number watched a replay at circa £15 a ticket (the round three price) Newport would take approximately 300k away. -Manchester United had 73,899 fans at Old Trafford for their match against Derby in round three. At circa £40 a ticket, Yeovil could leave with over a million pounds. While the magic of the Cup may be wearing off for fans of big clubs, the (economic) magic for small clubs is alive and well. With Premier League teams expanding stadiums, and building new ones, the value of a good cup run for small clubs could be more attractive than ever. By John Considine According to the media, the first goal awarded in English football as a result of the recently introduced system video assistance occurred last night. One could debate if the award was unambiguously as a result of the new system. While one of the on-field assistant referees flagged for an offside, there is no certainty that goal would have been disallowed in the absence of a video. The referee might have consulted with the assistant and allowed the goal to stand. It has happened. This blog post is not about whether or not we can say Leicester City's goal was purely as a result of the new system. This post is about the system and the implications for competitive balance (CB). In that respect two other points are important to note. First, the goal came in an FA Cup game - a knockout tournament. Second, it was awarded to the team that plays in the highest tier of English football (and against the team that plays its league football in a lower tier of English football). The greater accuracy of video favoured the stronger team. These type of issues are addressed in work by Loek Groot. Of particular interest is a 2009 paper published in the Journal of Institutional and Theoretical Economics. Groot uses a Donald Duck story (Football Fever) to draw attention to the way spectators like some degree of uncertainty. He then goes on to model what might be expected. He says "the adoption of TV monitoring and other features to help the referee and linesmen means that the right decisions will be bought at the price of a lower CB: higher accuracy reduces CB". The key idea in Groot (2009) is the natural level of competitive balance in a sport. He argues that sports with higher frequency of scoring have lower natural levels of competitive balance. He claims that this justifies greater levels of intervention by governing bodies to aid competitive balance, e.g. the sequence of draft picks. He contrasts this with the use of video referees. He says there is greater use of video refereeing in higher scoring sports. This means that the lower natural level of competitive balance is reduced further. Groot points out that even within a sport the type of tournament can be important for competitive balance. Knockout tournaments have lower levels of natural competitive balance compared to round-robin tournaments. The repeated interaction of round-robin tournaments means that errors of impartial referees should cancel out. However, a refereeing error in a knockout tournament is different. Using data from the latter knockout stages of major international tournaments, he says that only 10% of games are decided by more than one goal. An error here can have huge implications. In these situations the accuracy benefits of TV monitoring might outweigh any reduction in competitive balance. Today, video assisted refereeing seems to be getting the benefit of the doubt. Leicester City beat Fleetwood Town by two goals. Would the system have got as much praise if it was a one goal difference with penalty kick looming? By Robbie Butler In the coming months those interested in the English Premier League will know the broadcasters that have won the rights to show live league matches from August 2019 to May 2022. I have previously addressed this topic here and here. I am at a loss to see how the “competition” forced upon the market by the European Commission has in any way helped consumers. With the likes of Amazon, Netflix and Facebook all suggested as potential bidders, the big losers in this could be the very people that opening up the market sought to protect. To understand why, an overview of the seven packages that are on offer from 2019 to 2022 need to be considered. These are presented below. Currently, two broadcasters, (BSkyB and BT) share the rights to the 168 live games per season screened. In order to win one of the seven packages a broadcaster must make a single, sealed-bid prior to the decision date. As no guidance as to what others are willing to bid is provided, bidders must bid high in order to have a chance of success. In some cases, this could be interpreted as overbidding in order to ensure success. Great news for the Premier League but bad news for bidders and customers of subscription channels.
The large increase in the cost of winning the rights, which will probably go above £2 billion per season from 2019-20, sustains the inflation we see in the transfer market. The reason players today earn far more than players even ten years ago, is largely due to inflation in the price of live games. In theory seven different companies could share the packages listed. If this were the case, seven different subscription charges would be required to watch all live games. As strange as this may seem, consumers would probably be better off if one company, for example Sky Sports as was the case from 1992 to 2007, won the rights to all 200 games. Odd that a monopoly is preferable to "competition". The reality of course is that this is not competition but instead has led to the creation of seven different monopolies. Prices would fall, and with it transfer fees and player salaries, if more than one broadcaster could buy the same package. Only then will the market be competitive. |
Archives
December 2024
About
This website was founded in July 2013. Categories
All
|