The Economics of Sport
  • Sports Economics
  • About
  • Workshop
  • Selected Publications
  • Book Reviews
  • A Primer on Gaelic Games
  • Upcoming Events
  • Media
  • Education
  • Resources & Links

Summer Break

17/7/2026

 
We will take our normal summer break from today, much later than normal, due to the excitment of posting about the World Cup, Tour de France and GAA season.

We will return on the 31st of August 2026. 

Added Time And NBC News

17/7/2026

 
By Robbie Butler

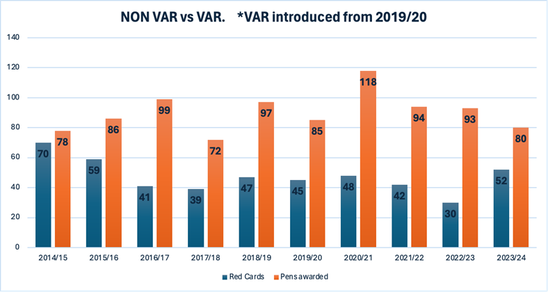
Our recent paper in the Journal of Sports Economics "Objective Calls Under the Spotlight: Referee Consistency and Behaviour on Football's Biggest Stage" was picked by by NBC Digital News. The story can be found here. 

Further coverage locally can be found here and here.

England's Travel At The World Cup

16/7/2026

 
By Robbie Butler

While England exited the 2026 World Cup last night, the Three Lions will still play the full complement of 8 games. The Bronze Medal game will be held Saturday night in Miami, Florida. It will be England's second visit to Miami in recent days and bring the curtain down on their trip to the United States, which also included a short stay in Mexico.

The full schedule is as follows. England played Croatia at Dallas Stadium (June 17), Ghana at Boston Stadium (June 23), Panama at New York/New Jersey Stadium (June 27), DR Congo at Atlanta Stadium (July 1), Mexico at Mexico City Stadium (July 6), Norway at Miami Stadium (July 11), and Argentina in the semi-final at Atlanta Stadium (July 15), and after the semi-final defeat to Argentina, they now head back to the Miami Stadium to meet France.
​
Plot those eight fixtures on a map and the scale of the undertaking becomes clear. Measured venue to venue as the crow flies, England's itinerary covers some 10,100 km (about 6,300 miles, from Texas up to New England, down the eastern seaboard to Atlanta, across the border to the altitude of Mexico City, and finally a shuttle between Miami and Atlanta to close out the tournament.
But that figure is only the floor.

In reality, England based themselves in Kansas City for the duration of the tournament, training at Swope Soccer Village and flying out to each fixture from the middle of the country. The location was chosen precisely because it is central, an attempt to keep travel demands down across a tournament sprawled over three countries and 16 host cities. The irony is that a hub-and-spoke itinerary roughly doubles the distance flown. A return trip from Kansas City to each of England's eight fixtures works out at somewhere between 23,500 and 25,600 km (roughly 14,600 to 15,900 miles), depending on whether the squad returned to base between the semi-final and Saturday's bronze medal match or flew directly from Atlanta to Miami. Add the transatlantic legs to get the party there and home again, and England's World Cup will have involved around 40,000 km of flying - the circumferenceof the Earth roughly

What does that mean in emissions terms? Precise figures would require England's actual flight logs, but a reasonable estimate for in-tournament shuttling alone accounts for roughly 200-250 tonnes of CO2, with the transatlantic round trip adding perhaps 140 tonnes more. 

And the team is the smallest part of the story. Every squad at this expanded 48-team tournament faces a version of the same itinerary. Backroom staff, equipment freight and media operations travel separately. Most significantly of all, the tens of thousands of England supporters who criss-crossed North America to follow the side, many on long-haul flights from the UK for individual matches, will have generated emissions that dwarf the team's own by orders of magnitude.
None of this is unique to England, and little of it was avoidable once FIFA settled on a three-nation, continent-spanning format. A full account of all travel and emmission can be found in our European Sport Management Quarterly paper here.

Penalty Taking in the Medium Run

9/7/2026

 
By John Considine
Chapter 2 of Beautiful Game Theory is titled "Vernon Smith meets Messi".  Vernon Smith is an economist who shared the 2002 Nobel Prize with Daniel Kahneman.  Smith got it for his work in experimental economics.  Chapter 2 examines how, in an experimental laboratory setting, professional soccer players play a card game similar to a penalty kick.  The results show that the soccer players can "do the math" even if they might not be able to articulate their strategy.

To motivate the discussion in Chapter 2, the conversations around two penalty kicks are presented.  One penalty kick involved Messi.  There was a delay of one week between the award of the kick and the excution of the kick.  A few nights before the penalty kick was to be taken, a discussion took place between the goalkeeper and others.  It was of the "if he knows that I know that he knows that I know ..." variety.  The second penalty presented at the start of Chapter 2 comes from the 1994 FA Cup final.  The discussion takes place between Eric Cantona and the media after the game.  Initially, Cantona also engaged in the "if he knows that I know ..." variety of explanation before declaring "You know what?  The truth is that I just kicked it".

Beautiful Game Theory was published just over a decade ago.  If a second edition was being published today it might have another penalty added.  The penalty would illustrated a delay of just under 20 minutes.  Much shorter than the week that Messi had to wait and much longer than the time Cantona had to make up his mind.  The penalty would come from the end of the AFCON final of 2026.  The taker was Morocco's Brahim Diaz.  Diaz attempted a "Panenka" against a goalkeeper that had previously saved another "Panenka" from Sergio Aguero.  Moreover, he attempted it with his "weaker" foot.  That particular penalty is a useful one to consider when considering the differences in the economic and psychological explanations of player behavior (e.g. here or here).

If there is a penalty for Morocco in tonight's World Cup quarter-final then there is a good chance that Diaz will take the penalty.

Does Donald Trump have a point about red cards?

8/7/2026

 
By John Considine
A previous blog post on this site suggests that Donald Trump might be on to something when he questions the purpose of red cards.  That post is called "What's wrong with soccer?" and the question itself is from a publication in the Georgetown Law Journal.  The publication raised the issue of the time invariance of the red card.  Compare the issuing of a red card in the 1st minute versus 89th minute.

Then there is the issue of a player being banned from a future game.  Seen as a punishment, it seems logical that a player and team might suffer beyond the game in which the offence occured.  However, if one looks at who benefits, then it is a little less clear.  There is a sort of externality for a team not party to the original transgression.

Competitive Balance Fears in the Tour De France

7/7/2026

 
By John Considine
Picture
After yesterday's third stage in the Tour De France the fear and loathing started.  If one was to look at the General Classification times then one might think that this could be a titanic contest for the next three weeks.  The two riders that have shared the last six victories are tied at 8 hours 46 minutes and 55 seconds.  But there are warning signs that the racing could become predictable.  And many fear it.

In the immediate aftermath of the stage, as part of the Breakaway show, TNT Sport broadcast an excellent interview with the stage winner Tadej Pogacar (here).  The interviewer was polite and the questions seemed innocent enough.  To start Pogacar was smiling and enjoying the moment.  Then the interviewer started the next sentence with the words "You are apparently very hungry ...".  Almost immediately, Pogacar's expression changes.  He effectively ignores the remaining words of the interviewer and replies "I'm not so hungry, I eat every 30 minutes ...".  The remaining words of the interviewer were " ... you could have left the breakaway go but you wanted to win today".  It is a familiar accusation.  Pogacar takes most of the food at the table and leaves only crumbs for his rivals.  Pogacar did provide some reply to that part of the implied question and then suggested that he needed to go warm down.

The folks in the Breakaway shows knew the significance of the interview.  They too had voiced similar concerns.  However, the ex-pro cyclists on the panel were having none of the suggestion that a competitor should not try to win as much as possible.  However, the excellent presenter, Orla Chennaoui, played the devil's advocate.  She wondered if the race would become boring.  If the outcome becomes predictable then viewership is likely to decline.

Competitive balance fears after only three stages of a 21-stage race.

The organisers might have contributed to these worries by their decisions on the structure of the 21 stages.  It is common for the early stages to faciliate the Yellow Jersey ending up on the back of a sprinter or a rider more suited to one-day classics.  The decision to put a team time trial as stage 1 and to have a particular format in that TTT could be coming back to bite the organisers.

And the results are ...

6/7/2026

 
By John Considine
The previous post suggested the impact of a regulation change in the team time trial for this year's Tour De France.  Previously all members of the team got the same time as the fourth team member to cross the line. This resulted in groups of four or five riders crossing the line in close proximity.  This year each team member got their own time.  Therefore, as time is only crucial to a few riders in a team of eight, we expected a greater spread of times.  The outcome supports what was expected.
Picture
The picture above is for the six teams that filled the top 10 fastest time.  They are ordered as presented in the legend above the tines.  The fastest rider came from Visma.  The second fastest from INEOS.

The gap between the first rider from a team to cross the line and his teammates is presented.  Most of the second riders are within 40 seconds of their team leader.  An insurance policy of sorts.  One can never tell when misfortune strikes.  For example, one of the "better" INEOS riders had a mechanical problem and that could explain their flatter line.  For the purpose of this post, the time of the fourth rider is important.  The gap to the leader can be measured in minutes.  The results are as expected.  A little bit of (economic) theory can do a lot of heavy lifting. 

Tour De France 2026 and the Triple T.

3/7/2026

 
By John Considine
A popular introductory economics textbook begins by identifying three principles of economics.  One of those principles is equilibrium and the textbook uses the free rider problem to illustrate the principle.  The free rider problem arises when there is not a clear link between individual effort and individual reward.  The free rider is one who seeks to gain without contributing to the production process.  Self-interest suggests that in particular circumstances individual will free ride.  When everyone attempts to free ride then the product is not delivered.

One of my favourite approximations to the economics version of the free rider problem comes from a similar situation in cycling.  The cyclist Rui Costa has a reputation for using the free rider strategy.  As a result, others tend to avoid breakawys from the peloton involving Rui Costa.  However, it sometime happens that he gets into a breakaway and successful employs the strategy for himself.  A good example being a stage of the Vuelta from three years ago (YouTube video here).  Costa was one of three riders who cooperated to break away from the peloton.  As is normal, cooperation broke down as they approached the finish line.  Cooperation turns into competition (a 2019 Journal of Economic Psychology describes it as "friends for almost a day").  The other riders knew of Costa's reputation as a free rider.  Try as they might, they failed to counteract it.

Aligning individual effort and reward can be difficult in a team setting.  In this post, I want to focus on a different example of the relationship between individual effort and reward.  Rather than looking at a regular road stage in one of the Grand Tours, I want to look at the team time trial.  Even here there are variations that have important implications for individual effort and team cohesion.  The 2026 edition of the Tour De France begins with a team time trial.  However, the organisers have changed the reward structure from that used in recent years.

Previously, all members of the team received the time of the fourth placed rider from that team to cross the line.  Therefore, the gap between the first rider to cross the line and the fourth rider to cross the line was minimal.  Beyond the fourth rider the gaps tended to increase.  Many teams decided that they did not need their fifth, sixth, seventh, and eight riders to finish anywhere need the fourth rider.  It might be inefficient to have anything left in the tank of the fifth rider.  Therefore, some riders burnt themselves out like booster rockets.  As all the members of the team got the same time then such a strategy made some sense.

Tomorrow, around the roads of Barcelona, the rewards are different.  Each cyclist will get the time at which they cross the line.  It should make a difference to the distribution of times by individual team members.  It is unlikely that we will see the first four riders from teams finish as a group.  Those teams devoted purely to getting their team leader to cross the line as quickly as possible might burn up all riders but the leader.  Only the General Classification riders and those seeking the young riders jerseys are primarily focused on time.  Those teams with riders targetting stage wins or those riders playing the role of domestiques might continue to sacrifice themselves for a team leader.  It is hard to see any team with four riders who are attempting to minimise their time over the 21 day stages and 3,333kms.

Therefore, we can expect a wider dististribution of times for riders than previously.  Those distributions will reveal the preferences of the individual teams.  There will be a wider dispersion for teams focused purely on General Classification.  ​It will be interesting to see how this experiment with the team time trial works (it has been used in other races).  From Sunday it will be back to the more regular road race stages (with the exception of the individual time trial on Stage 16).

Scoreboard Relics

2/7/2026

 
By John Considine
Picture
The picture opposite show a scoreboard problem and solution.  The game was an international soccer game between Ireland and France.  The game was played in a venue primarily designed for Gaelic games.  This included the scoreboard.  The soccer game needed only the first digit in the 0:00 for each team so as to count the number of goals.  The ":00" was not needed and only served to confuse.  The solution was a make shift cover on this part of the scoreboard.

While the scoreboard in the picture is less than 10 years old, the presentation of the score is a relic from the past.  There are a number of arguments for changing the layout of the scoreboard.  About the only reason for keeping the current layout is that it might remind people that there was a time when the game was determined by the first digit.  The team with the most goals won.  In the event of the goals scored being the same for both teams then the remaining digits (points) determined the outcome.  Nobody alive remembers those days.

For a couple of years, Gaelic football has three different score values.  One score is worth three points, one worth two points, and another worth one point.  Only the first and last are represented on the scoreboard.  The scoreboard does not present the number of two-pointers.  The two-pointer is folded into the points element.  One of the most significant changes in the sport is not presented for the patrons.  But does it need to be?  The outcome of the game is determined by the points total from all types of scores.  Why not treat goals as three-pointers and only present the points total on the scoreboard?

American football has even more score types than Gaelic football.  A touchdown earns a team six points.  Only the points total is presented in the NFL.  It is easy for somebody without any knowledge of the game to see who is leading.  They don't need to know if the scores came from extra point conversions, 2-point attempts, safeties, or touchdowns.  A person unfamiliar with Gaelic games might wonder about a 2-14 to 4-09 scoreboard display.

It is less than two decades since the GAA lifted it's ban on the use of GAA grounds by some other sports.  In those two decades a different shade of green has become more important.  The need to fund the development of the games has superceded the need to promote a nationalistic mindset.  As a result, some of the bigger venues are used for soccer and rugby union games.  Rugby union also has multiple score types but the total points are the only ones displayed in rugby union scoreboards.

The scoreboard at GAA venues is unlikely to change anytime soon.  Like the qwerty keyboard on most devices it is likely to persist.  Designed for one function, it does a passable job for a changed world.

Hurling & Gaelic Football: Geographical Concentration or Competitive Imbalance?

1/7/2026

 
By Daragh O'Leary

Few issues matter more in sport or economics than competitive balance. It shapes spectator interest, broadcasting value, and ultimately the legitimacy of competitions. Unsurprisingly, it has become a major talking point in hurling over recent weeks following Offaly and Dublin’s heavy defeats to Cork and Clare respectively.

Naturally, conversations of concern have sprouted among pundits, mostly Leinster and Ulster-based ones, on national media platforms like Off the Ball and the Irish Independent about the gulf in quality between provincial championships in hurling. Thankfully, these pundits were quick to point out that all hurling needs to do is take a look at Gaelic football to see how radical changes can help hurling fix itself. This does however beg the question of what exactly hurling need to take from the competitive structure of Gaelic football?

I have written previously on the topic of geographic variations relating to the level of interest which exists within Ireland for hurling and football – see here. Broadly speaking, hurling is more popular in the South with the exception of Kerry, whereas football is more popular in the North with the exception of Antrim. This is demonstrated in the below maps which show the outright betting odds for this year’s All-Ireland Hurling (left) and Football (right) Championships. 
Picture
While there is clearly better representation from counties within Munster in hurling and better representation from counties from outside of Munster in football, there appears to be no major difference in the competitive balance between the favourites and the chasing teams in the two sports. Meaning the “issue” hurling has is one of geographical concentration rather than competitive imbalance. These are completely different topics.

Of hurling’s semi-finalists, Limerick are the favourites at a price of 8/13, ensuring a return of roughly €0.62 for every €1 bet. The Cork hurlers follow behind in second at 15/8 and then you have Galway and Clare at 8/1 and 10/1 respectively.

Football on the other hand has a far clearer favourite with Kerry being priced at just 4/7 ensuring only a €0.57 return for every €1 bet. Meanwhile the second favourite, Dublin, are priced at 7/2 ensuring a €3.50 return on every €1 bet, a whole +€1.62 more than the second favourite in hurling. Mayo and Louth make up the remaining teams priced at 4/1 and 12/1 respectively. What benefit is this greater geographical spread of football when it has lower competitive balance between first and second?

Overall, the mean betting odds for each of the last four remaining teams in hurling is 5.12, whereas the football is 5.02. The mean difference in betting odds for the 2nd, 3rd, and 4th favourite in hurling compared to the favourite is 6.01 compared to football’s 5.93. In short, talk of football achieving some kind of superior balanced competitive structure which hurling needs to learn from doesn’t seem to stack up to the evidence despite football’s final four being more spread out geographically.

Maybe then it is the competition within the provincial championships which matters. But again, it seems slightly disingenuous to suggest football triumphs in this regard. Kerry have won 24 of the last 30 Munster Football Championships, Dublin have won 20 of the last 30 Leinster Championships, and Galway & Mayo have won 23 of the last 30 Connaught Football Championships. Yet we hear no calls for the Ulster Football Championship to be broken up to ‘fix’ football.

In comparison, Kilkenny have won 22 of the last 30 Leinster Hurling Championships, which is comparable to Dublin’s dominance in Leinster’s Football Championship (20/30), while Limerick have won just 8 of the previous 30 Munster Hurling Championships.

It will be interesting to see how evenly contested the finals of hurling and football are this year and what kind of discussion we get afterwards about overall competitive balance. Kerry being, by far, the clear favourites to win this year’s All-Ireland in football after their recent dismantling of Tyrone and Armagh doesn’t seem to generate quite the same level of concern as Munster team’s performances against Leinster counties in hurling.

The recommendation to solve this imbalance in football seems to be that we should simply sit back and marvel at David Clifford rather than contemplate structural overhauls to the All-Ireland Football Championship. Meanwhile the much closer contest between hurling’s top two teams seems to be a cause for concern for Leinster-based pundits unhappy with their own province’s level of quality. I can’t help but wonder whether we would be having this conversation at all if Kilkenny had not had such a poor year.

I will finish with what I believe to be a fitting line from Cork hurler, Darragh Fitzgibbon; ‘Don't break Munster while fixing hurling’. 
<<Previous

    Archives

    July 2026
    June 2026
    May 2026
    April 2026
    March 2026
    February 2026
    January 2026
    December 2025
    November 2025
    October 2025
    September 2025
    August 2025
    July 2025
    June 2025
    May 2025
    April 2025
    March 2025
    February 2025
    January 2025
    December 2024
    November 2024
    October 2024
    September 2024
    August 2024
    July 2024
    June 2024
    May 2024
    April 2024
    March 2024
    February 2024
    January 2024
    December 2023
    November 2023
    October 2023
    September 2023
    August 2023
    July 2023
    June 2023
    May 2023
    April 2023
    March 2023
    February 2023
    January 2023
    December 2022
    November 2022
    October 2022
    September 2022
    August 2022
    July 2022
    June 2022
    May 2022
    April 2022
    March 2022
    February 2022
    January 2022
    December 2021
    November 2021
    October 2021
    September 2021
    August 2021
    July 2021
    June 2021
    May 2021
    April 2021
    March 2021
    February 2021
    January 2021
    December 2020
    November 2020
    October 2020
    September 2020
    August 2020
    July 2020
    June 2020
    May 2020
    April 2020
    March 2020
    February 2020
    January 2020
    December 2019
    November 2019
    October 2019
    September 2019
    August 2019
    June 2019
    May 2019
    April 2019
    March 2019
    February 2019
    January 2019
    December 2018
    November 2018
    October 2018
    September 2018
    August 2018
    July 2018
    June 2018
    May 2018
    April 2018
    March 2018
    February 2018
    January 2018
    December 2017
    November 2017
    October 2017
    September 2017
    August 2017
    July 2017
    June 2017
    May 2017
    April 2017
    March 2017
    February 2017
    January 2017
    December 2016
    November 2016
    October 2016
    September 2016
    August 2016
    July 2016
    June 2016
    May 2016
    April 2016
    March 2016
    February 2016
    January 2016
    December 2015
    November 2015
    October 2015
    September 2015
    August 2015
    July 2015
    June 2015
    May 2015
    April 2015
    March 2015
    February 2015
    January 2015
    December 2014
    November 2014
    October 2014
    September 2014
    August 2014
    July 2014
    June 2014
    May 2014
    April 2014
    March 2014
    February 2014
    January 2014
    December 2013
    November 2013
    October 2013
    September 2013
    August 2013
    July 2013

    About

    This website was founded in July 2013.

    RSS Feed

    Categories

    All
    American Football
    Athletics
    Baseball
    Basketball
    Behavioural Economics
    Boxing
    Broadcasting
    Competitive Balance
    Cricket
    Cycling
    Darts
    David Butler
    Declan Jordan
    Drugs
    Ed Valentine
    Epl
    Esports
    Expenditure
    F1
    Fifa World Cup
    Finances
    Funding
    Gaa
    Gaelic Games
    Gambling
    Game Theory
    Gary Burns
    Geography
    Golf
    Greyhound Racing
    Guest Posts
    Horse Racing
    Impact Studies
    John Considine
    John Eakins
    League Of Ireland
    Location
    Media
    Mls
    Mma
    Olympics
    Participation
    Paul O'Sullivan
    Premier League
    Regulation
    Research
    Robbie Butler
    Rugby
    Simpsonomics
    Snooker
    Soccer
    Spatial Analysis
    Sporting Bodies
    Stephen Brosnan
    Swimming
    Taxation
    Teaching
    Technology
    Tennis
    Transfers
    Uefa
    Ufc
    World Cup
    Wwe

Powered by Create your own unique website with customizable templates.