The Economics of Sport
  • Sports Economics
  • About
  • Workshop
  • Selected Publications
  • Book Reviews
  • A Primer on Gaelic Games
  • Upcoming Events
  • Media
  • Education
  • Resources & Links

Sports Capital Grants – The Ten Presenters

8/11/2017

0 Comments

 
By Sean O'Connor

My last few pieces on this blog (here and here) have focused on the distribution of Ireland’s sports capital grant funding over the period 2002-2015. We’ve examined the breakdown in terms of inequality; nationally, regionally and also amongst different types of sports. Today’s piece will delve further into the distribution of capital grants, utilising the share amongst the deciles to highlight how much income is received by the bottom, as well as top ten percent.

Deciles are a simple way to measure income inequality within a country. Simply put they can be utilised to examine how much of total income in a country/region is earned by those in the lowest wage earning groups and those in the highest wage earning bracket. The deciles split the population into equal groups of ten and look at the share of income within each group. To begin Figure 1 provides the breakdown of the deciles over the entire period.
Picture
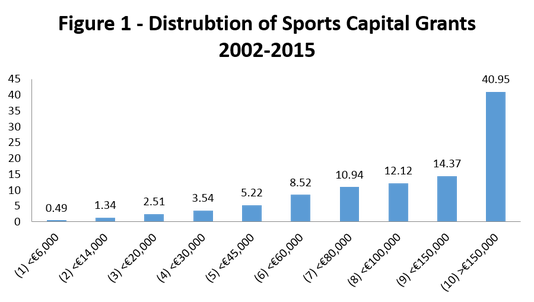
Figure 1 indicates clubs who received grants of €6,000 or less would be grouped into the lowest decile, whereas clubs who received grants in excess of €150,000 would be in the top. Given the total number of clubs who received funding during the period was 7,615; each group or decile consists of circa 761 recipients or sports clubs. Interestingly from examining Figure 1 the bottom 761 clubs who received grants of less than €6,000 over the period, accounted for 0.5% of the total cumulative share of awards given out. Conversely, the top ten percent of recipients accounted for 41% of the total value of grants awarded over the period. In other words, in total, 761 sports organisations received circa €231,000,000 worth of funding between them, or on average €312,022 per recipient. Figure 1 would point to the fact much of funding distributed over the period is concentrated in a number of large grants given to a small number of clubs. Given this, it’s also worthwhile to examine how this distribution alters from year to year. Therefore, Table 1 examines the distribution amongst the deciles from each period.
Picture
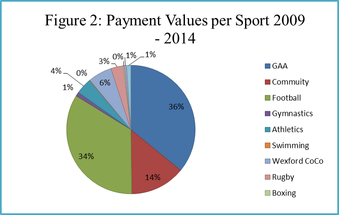
Table 1 presents information of the distribution of sports capital grants per year and across deciles. The row signified by N refers to the number of grants given out to individual clubs during the period, while the row marked value refers to the total amount funding given in that year. So in 2002, 837 individual grants were given out with a total value of €75,400,000. Interestingly, the cumulative share of grants for the bottom ten percent of clubs never once reached one percent. Contrast this to the top ten percent of clubs who in any given year received close to two thirds of the available funding. In particular years this distribution was even more extreme. For instance, in 2003 circa 61 clubs received 42% of the overall funding available (€51,900,000), whereas in 2008 68 clubs took over half the funding available in that particular year, while the top 1% in 2008 took 18.55%. It’s also interesting to look at share of funding of the top ten percent across different counties. Figure 2 plots this for each county over the entire period.
Picture
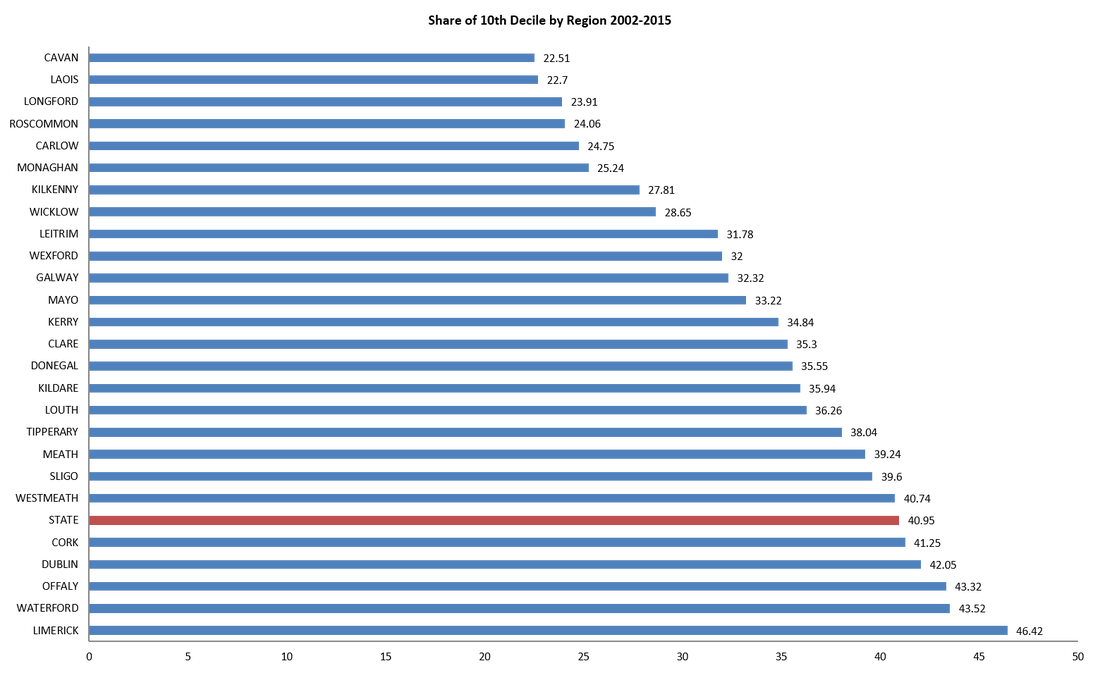
The red line in Figure 2 denotes the share of grants received by the top ten percent of recipients nationally over the period, whereas each blue bar highlights the share of the top ten percent within each county over the period. We notice five counties are above the national average over the period in terms of the share of grants received by the top ten percent of clubs. These regions are Waterford, Offaly, Limerick, Dublin and Cork, with the impact being most pronounced in Limerick. While such an analysis sheds further light on the distribution of Irish sports capital grants, a follow up piece on this blog will provide a breakdown of the distribution of grants across the deciles for a number of different sporting codes. 
0 Comments

Sports Capital Payments to Wexford 2009 – 2014

23/1/2016

 
by Kathy Stout

In previous posts John Considine has extensively examined the allocation of the Irish Sports Capital Grant (here, here, here, here and here). This post examines the allocation, between 2009 and 2014, for one such county; Wexford.

Wexford’s sports capital payments are an example of a matching grant which is where the relevant governmental department matches funds contributed by the applicant. In this scenario of 100% of the funding, the state pays for 70%, the other 30% by the sporting institution. Wexford did not engage in any major development projects so is below the average level of payments per county from 2009 to 2014. One of the main observations found is despite the GAA receiving the highest number of payments, football associations were allocated the highest amount of funding per sport due to their ability to give more to the matching grant scheme from the profits they make.

Table 1 below provides information on the annual grant provided to the county and the annual percentage change in allocation. The striking drop in funding is explained in part by its correspondence with the Irish fiscal crisis,as the economy had contracted from $273.7bn in 2008 to $233.5bn in 2009 with a further drop to $218.4bn in 2011.
Picture
Another explanation for this initial drop is the restriction on grant applications in 2008. After this year applications for grants by sporting institutions were not accepted, however payments were still being made for the following years based on previous applications. In Wexford’s case the majority of these had been paid in 2009, accounting for the considerable decrease in 2010. 

​Whilst the average payment size does see a drop from 2009 to 2010, there is substantial variation over the following years showing that it is the number of payments made, and not the average payment size, which makes the most impact on the overall yearly amounts paid out. The average payment in 2012 is €41,736, relatively speaking not far from the 2009 figure of €48,554.26 however the difference of eleven payments in 2012 versus thirty-eight in 2009 explain the difference in total funding. It is apparent from the data that GAA and football clubs receive the largest grants (for the most part), due to their ability to contribute more money to the grant to be matched, and sports with lower levels of engagement (and profitability in general) such as rowing, gymnastics, swimming, and athletics receive the smallest sized grants. Figure 1 below illustrates the dominance of GAA and football in terms of the number of grants awards. 
Picture
Picture
As you might expect, the greater number of grants directed towards GAA and football translates into greater payments to these sports (Figure 2). The GAA received 38% of the number of payments approved and 36% of the total monetary funds paid out. In comparison, football payments accounted for 25% of the number of payments allocated but gained 34% of the total monetary value. This indicates that while there were less football grants, on average they were of a larger value.

What is also evident is football clubs were in the position to contribute more to the grant scheme in this time showing that within Wexford, this is the most profitable sport.

Kathy Stout is a final year Bachelor of Arts student. She is a recipient of a University College Cork Quercus Academic Scholarships and is currently Auditor of the UCC Economics Society.

Bidding for Large Sports Events - Irish Citizens Beware

17/2/2015

0 Comments

 
by Declan Jordan
Picture
The issue of governments bidding for large sports events comes up again and again. It's fair to say the consensus view among economists is that these bidding processes are inefficient and wasteful. Governments engage in rent-seeking behaviour to capture the rights that are in the monopoly control of the large sports bodies such as the International Olympic Committee, FIFA, UEFA or World Rugby. There is also the spectre of corruption associated with almost all decisions on hosts of large sports tournaments.

Ireland has committed to bidding for the Rugby World Cup in 2023.There have been several posts on this blog relating to that bid - which are summarised here. Despite the consensus view that countries do not benefit financially from hosting these mega sports events, it is still remarkable that many countries still seek to host them. In Ireland's case one of the primary reasons put forward for bringing the Rugby World Cup is that it would provide a substantial boost to tourist numbers. (It's worth noting that the assumptions and figures are not publicly available).

A new paper in Applied Economics by Heather Mitchell and Mark Ferguson Stewart called "What should you pay to host a party?" (requires a subscription), considers the relationship between tourism and three football World Cups and five Olympic Game. The authors find very little positive effect. This is worth bearing in mind for the Irish bid.

The paper suggests another reason why governments may be willing to support bids for large sports events and this is based on significant evidence that these events are associated with greater happiness levels in the host country. The paper argues that governments are seeking to generate a feel good factor that can be turned to political gain. There may be something in this but it is a gamble because bids are made many years in advance of hosting an event and governments may be providing a boost to future governments that may not include their own parties. Admittedly this is only a problem in democracies.

Mitchell and Stewart also suggest that the happiness of the population is also based on ignorance. They say:

Although people feel happy when hosting these events, this is probably because they are unaware of, and certainly do not feel personally responsible for, the cost of both acquiring and putting on the event. Part of the reason for this is because the bidding costs are usually concealed from the public; and this is also often the case with the full cost of staging the event.

As a potential solution to this rational ignorance among voters and to address the inefficiencies in the bidding process, the paper recommends that large sporting events would be allocated using an auction. This would mean citizens would be able to see clearly how much hosting a sporting event will cost. This is not a bad idea but is unlikely to be welcomed by sporting bodies. The payments to them as part of hosting a bid (the monopoly rent) is not very transparent and they would not like it to be. The payment to the sporting body may also be only a (small) part of the total cost of hosting an event, with infrastructure investment (a lot on white elephants) probably accounting for a greater proportion of the cost. It means citizens are just as likely to remain rationally ignorant of the cost they are paying for their sporting buzz.
0 Comments

More Sports Pork: Three Natural Experiments

15/5/2014

0 Comments

 
By John Considine
Picture
In 2008 I published a paper with a number of colleagues in Economic Affairs.  The paper was titled 'Irish National Lottery Sports Capital Grant Allocations 1999-2007: Natural Experiments on Political Influence'.  The paper examined what happened to the geographical distribution of sports capital grants when there was ministerial change.  The two ministerial changes examine were (i) a change in the Minister for Sport and (ii) a change in the Minister for Finance.  The paper claimed there was evidence of political bias in the funding.  Jane Suiter and Eoin O'Malley used a more sophisticated statistical approach on the 2002-2007 grants and found similar results (see previous blog post here).  This post outlines the evidence from our Economic Affairs paper and adds another natural experiment with 2012 data.

Sport grant applications for National Lottery funding are sorted and assessed by county.  There are 26 counties in the Republic of Ireland.  The counties can be seen in the map opposite.  Those in the Republic of Ireland are in dark green.  At the time of our 2008 publication the counties of interest were Donegal and Kerry in respect of the Minister for Sport and Kildare and Offaly for the Ministers for Finance.  Donegal and Kerry are located on the western side of the country whereas Kildare and Offaly are located in the midland/east of the country.

Table 1 shows what happened when there was a change in the Minister for Sport.  While the Minister for Sport came from Donegal, that county had the highest per person ranking of the 26 counties.  When he was replaced by a Minister from Kerry then Kerry jumped to the number 1 spot and Donegal slipped to 23rd out of the 26 counties.

Picture
Our second "natural experiment" looked at what happened when the Minister for Finance changed.  Our results in Table 2 below show that while the Minister was from Kildare then Kildare received the second highest per person allocation of sports capital grants.  When this minister left office, Kildare dropped to 26th (or last).  The Minister for Finance for the 2005-7 grant allocations was from Offaly.  This county had previously been 20th in the ranking.  It jumped to 4th while its native son was in Finance.
Picture
As economists these results seemed to suggest to us that the behaviour of politicians might be rational and self-interested.  There was no moral outrage in the paper.  It seemed to us that the incentives were such that the outcome was fairly predictable.

The National Lottery was started in 1986.  It was only in its infancy when politicians complained about the use of National Lottery funds.  In 1988 Mary Harney (Progressive Democrats) claimed that "Fianna Fail have engaged in the most despicable exercise in gombeen politics ever seen in this country in the way they have handled the allocations from the national lottery" (here).  A couple of year later the Progressive Democrats were in government with Fianna Fail.  Now it was the turn of Alan Shatter (Fine Gael) to remind Mary Harney and her Progressive Democrat colleagues of her previous words (here).  He finished with a flourish saying "The horse of political patronage will once again be ridden and the Minister, Deputy Flynn, like the Lone Ranger of old, will gallop off into the sunset with his faithful Tonto, Deputy Harney, the Minister of State, galloping along beside him".  It would seem that Fianna Fail was the force corrupting all who came in contact with them.  Tables 1 and 2 above might support that view as all four Ministers were from that political stable.

In 2012 Alan Shatter's political party was the largest party in a coalition government between Fine Gael and Labour.  Alan Shatter himself was Minister for Justice.  Sport was being catered for by the Department of Transport, Tourism and Sport.  One of the junior ministers in the Department was responsible for allocating the sports capital grants.  The Minister come from Mayo.  This gives us our third natural experiment.  It is presented in Table 3.  The data is that produced by the Department during 2012.  Galway and Mayo are listed as having received €132 for the 1998-2011 period so Mayo is 15th or 16th (joint 15th).
Picture
Maybe in future rounds, a rule limiting the dispersion of per person county allocations will be formalised.  It should apply to ALL sports capital grants and not some or most of them.  It should not be the case that it will apply to 85% of the grants.  It should apply to 100%.  The omens are promising.  Last Sunday, speaking on RTE's The Week in Politics, the Minister for Transport, Tourism and Sport, Leo Varadkar, said "... also we need cultural change. You know too much in Ireland, and its not just a Garda issue, we still have a culture of doing favours, the nod and the wink, use of discretion, those type of things.  And we need now, over the next ten or twenty years, to move to a rules based society so that this kind of stuff doesn't happen anymore.  And it is not just about the Gardai it is about politics in general ..".  Let's not wait for 10 or 20 years.  The Minister would set a good example by starting in his own department and ensuring that there is limited Ministerial discretion on the allocation of ALL sports capital grants.
0 Comments

Sports Pork: Core Voters, Swing Voters and Institutional Rules

7/5/2014

0 Comments

 
By John Considine
A Parliamentary Affairs article by Jane Suiter and Eoin O'Malley, available through the "advanced access", has some interesting findings about the allocation of sports grants in Ireland.  Suiter & O'Malley examine various explanations of how government expenditure on sports and education is geographically allocated.  They point out that the literature suggests that expenditure might be directed towards the government's core supporters, towards swing constitutencies, or it could be determined by the decision making rule.  They test these alternatives using Irish data.

They note that in the Irish political system "the minister, has clear and predictable incentives for targeting spending".  They also note that in The 2007 Irish Candidate Study "sports clubs and schools are the top two areas that legislators themselves believe it is worth claiming credit for".  Given Ireland Proportional Representation - Single Transferable Vote system, one might expect the government expenditure to be related to the geographic location of the deciding minister(s).

Suiter & O'Malley run three models to test if expenditure might be directed towards the government's core supporters, towards swing constitutencies, or if it is determined by the decision making rule.  The results of their tests are presented in the table below (Table 4).  The third model tests their suggestion that the decision rule is the most important.  They say their "results are both positive and highly significant and the model shows that constitutencies of the decision-making ministers do significantly better than other constituencies".  It seems the sports grants go to the constituency of the Minister for Sport and the Minister for Finance.
Picture
0 Comments

Optimism Bias and Strategic Claims

9/12/2013

0 Comments

 
By John Considine
The release of the Anglo Irish Bank tapes in the summer of 2013 revealed the bank’s strategy for securing public funding (here).  Anglo executives decided to look for €7bn even though they knew they would probably need more. Their strategy was revealed in the following quote from the tapes "... that number is seven (€7bn) but the reality is that actually we need more than that. But you know the strategy here is that you pull them in, you get them to write a big cheque ... and they have to support their money.”
Picture
Do those seeking to attract mega sports events take the same strategic approach or is it optimism bias that causes them to consistently understate the cost of the project?  It is difficult to say whether the answer is optimism bias or strategic claims.  However, there is little doubt that there is consistent understatement of the costs.  This point is illustrated in a working paper from Said Business School by Bent Flyvbjerg and Allison Stewart (here).  Their paper examined every Olympic Games since 1960 and it shows that every (yes, every) single games ran over budget.   The average cost overrun is 324% in nominal terms and it is 179% when inflation is removed.

Flyvbjerg & Stewart throw much cold water on the claims that London 2012 came in on budget.  This is a point taken up by Financial Times journalist John Kay.  Kay traces the evolution of the cost estimates that were commissioned by the Department of Culture, Media and Sport.  It started in 2002 with Arup estimating the costs at £1.8bn. A year later PwC estimated the costs at £3.1bn requiring a public subsidy of £1.3bn.  The bid submitted to the International Olympic Committee in 2005 put the costs at £4.2bn.  By 2007 the costs had risen to £6.5bn.
 
Irish sports people should not be surprised by the findings of Flyvbjerg & Stewart.  In October 2000 the Taoiseach (Prime Minister), Bertie Ahern, presented a €293m figure to the Dail (parliament) on the total costs of building a National Stadium in Abbotstown.  In January 2001, he apologies to the Dail for omitting another €68m in costs.  In February 2002 the consultants HPR estimated the cost of the project at €890m.  The stadium was not built.

The Punchestown Equestrian Event Centre was built.  In 1999 the original proposal sought 100% public funding for a €6.9m Centre.   In June of 2000 a revised proposal was submitted for €12.78m.  The proposal was approved.  A further €1.5m was approved in late 2001 – bringing the issue to the attention of the Public Accounts Committee.

Why the consistent underestimate of costs to the public purse?  There is probably a bit of optimism bias and a bit of strategic behaviour.

When it comes to major sporting events then the least we should look for is a full and transparent explanation of how the costs of the sporting events are estimated. If not we are likely to get underestimates like the €7bn provided by Anglo Irish Bank.  And, lest we forget, the Anglo executive claimed (here) he pulled that €7bn figure "out of his arse”.

0 Comments

Economic Value of Sports Related Purchases in Ireland

26/11/2013

 
By John Eakins
In 2010 Indecon published a report which looked at the contribution that sport makes to the Irish economy. One aspect of their report is the estimate of €1,885.6 million that they placed on the amount of money that Irish households spent on sport and sport-related goods and services in 2008. This was equivalent to 2% of the overall value of consumer spending in the economy at the time. In this blog I will provide an updated estimate of the economic value of sports related purchases using a similar methodology.
Picture
Indecon used the Household Budget Survey (HBS) as the basis of their figures and  that will be my start point too. The HBS provides information on the average weekly amount spent by Irish households on a large variety of commodities.  Isolating the sports related categories and simply aggregating across all households will therefore provide an approximation for the total annual spend.  To aggregate I use data from the recent Census (2011) which gives a figure for the number of private households in the state equal to 1,654,208.

Eight categories of sports relating spending were analysed and the calculations displayed in table 1 below. All values were taken from the 2009/10 HBS except for the ‘Sports/Leisure Wear’ value. This value had to be projected forward from the 2004/05 HBS as no distinct corresponding category existed in the 2009/10 survey. To find this value it was assumed that the share of ‘Sports/Leisure Wear’ spending in total clothing and footwear in 2004/05 remained the same in 2009/10.

Picture
Table 1: Sports Related Purchases by Irish Households 2009/10
As can be seen from the table €1097.6 million is estimated to have been spent by Irish households on the eight sports related categories in 2009/10. This corresponds to 1.33% of personal consumption in those years (taking an average of personal consumption in 2009 and 2010) and 0.69% of GDP in those years (again taking an average of GDP in 2009 and 2010).

It is possible to project forward to get a value for say 2012 but this requires making certain simplifying assumptions. In particular one can use the change in the consumer price index for each of the categories above to estimate weekly average expenditure per household in 2012. Thus we are assuming a price change only and quantity purchased has remained the same (which is debatable for many of the goods above although any changes in quantities purchased between 2009 and 2012 should not be too significant). Table 2 displays these calculations.
Picture
Table 2: Sports Related Purchases by Irish Households 2012
So in 2012 €995.56 is estimated to have been spent by Irish households on the eight sports related categories which
corresponds to 1.20% of personal consumption and 0.61% of GDP in that year.  This represents a fall on the 2009/10
figures although in our calculations the primary reason for this has been decreases on the prices associated with these goods.

The values are also much lower than the €1,885.6 million estimate providing by Indecon. Even the 2009/10 estimate is almost 60% below this figure. One of the reasons for this is that Indecon adopted a much broader definition of sports related purchases and included a proportion of the money that households spent on items such as travel, books & newspapers, TV licence and subscriptions and school & university fees. It is also the case that Indecon produced their estimates at the peak of the economic boom. A proper comparison with the Indecon results would require further research but in ignoring these secondary effects, the estimates from this blog are probably a little on the downside. However, even allowing for these secondary effects, it is clear that the recent recession has had a negative effect on sports purchases and this blog has provided a first attempt at quantifying that effect.

Irish Sports Expenditure: Social Status

5/10/2013

 
By John Eakins
This is the fifth post in the sequence on Irish household sport expenditure.  In this post the households are classified by social status of head of house.

Figure 5 tabulates median expenditures against the social status of the HOH. The patterns illustrated in Figure 5 appear to support the assertion that income is a greater determinant of spending on spectating than participation. With the exception of some outliers (i.e. unskilled, own account and farmers), there appears to be a downward trend in median spending from ‘higher’ social status groups (i.e. employers and managers) to the ‘lower’ social status groups (i.e. semi-skilled). This pattern is not as evident in the sport participation numbers.
Picture

Irish Sports Expenditure: Family Composition

4/10/2013

 
By John Eakins
Picture
This is the fourth is a series of daily posts on Irish household sports expenditure.  Previous posts examined household sports expenditure where the expenditure was classified by location (here), gender of head (here), and age of head (here).  Today I examine the sports expenditure by family composition.

Figure 4 shows that sports participation purchases are on average higher for households with 3 or more children present and households with single adults and children and the ‘all other households’ category (which represents households with 3 or more adults and possibly children). In contrast the spending on sports spectating is quite variable across the different categories of family composition. As highlighted in my previous blog (here), it is probably the case that spectating cost are driven more by income than by the composition of the family.

Each of this week's posts uses the median level of expenditure for both sports spectating and sports participation and across selected qualitative variables. Caution should be exercised when making inferences as the numbers in  some categories can be small, however some patterns of spending behaviour can be observed.

Irish Sport Expenditure: The Rural - Urban Divide

1/10/2013

 
By John Eakins
Picture
In a previous blog entry (here), I looked at the change in Irish household expenditures on two sports related items, admission charges for spectator sports and expenditures related to sports participation (excluding subscriptions).  From the analysis of the numbers, it appears that spending toward spectator sports has been harder hit by the fall in household consumption over the 2004/05 to 2009/10 period. In contrast, spending on participation sports, even in volume terms, increased over the period.

Starting today, I will look at five other decompositions of 2009/10 Irish household expenditure on sport.  This blog post will be one of five posts running from today (Tuesday) to Saturday.  The focus of this post is the Urban-Rural divide.  Figure 1 shows that there is greater levels of spending on sports spectating and sports participation by households from urban areas. This is not surprising given the proximity and ease of access that urban dwellers would have to sports events and sports facilities.

<<Previous

    Archives

    May 2025
    April 2025
    March 2025
    February 2025
    January 2025
    December 2024
    November 2024
    October 2024
    September 2024
    August 2024
    July 2024
    June 2024
    May 2024
    April 2024
    March 2024
    February 2024
    January 2024
    December 2023
    November 2023
    October 2023
    September 2023
    August 2023
    July 2023
    June 2023
    May 2023
    April 2023
    March 2023
    February 2023
    January 2023
    December 2022
    November 2022
    October 2022
    September 2022
    August 2022
    July 2022
    June 2022
    May 2022
    April 2022
    March 2022
    February 2022
    January 2022
    December 2021
    November 2021
    October 2021
    September 2021
    August 2021
    July 2021
    June 2021
    May 2021
    April 2021
    March 2021
    February 2021
    January 2021
    December 2020
    November 2020
    October 2020
    September 2020
    August 2020
    July 2020
    June 2020
    May 2020
    April 2020
    March 2020
    February 2020
    January 2020
    December 2019
    November 2019
    October 2019
    September 2019
    August 2019
    June 2019
    May 2019
    April 2019
    March 2019
    February 2019
    January 2019
    December 2018
    November 2018
    October 2018
    September 2018
    August 2018
    July 2018
    June 2018
    May 2018
    April 2018
    March 2018
    February 2018
    January 2018
    December 2017
    November 2017
    October 2017
    September 2017
    August 2017
    July 2017
    June 2017
    May 2017
    April 2017
    March 2017
    February 2017
    January 2017
    December 2016
    November 2016
    October 2016
    September 2016
    August 2016
    July 2016
    June 2016
    May 2016
    April 2016
    March 2016
    February 2016
    January 2016
    December 2015
    November 2015
    October 2015
    September 2015
    August 2015
    July 2015
    June 2015
    May 2015
    April 2015
    March 2015
    February 2015
    January 2015
    December 2014
    November 2014
    October 2014
    September 2014
    August 2014
    July 2014
    June 2014
    May 2014
    April 2014
    March 2014
    February 2014
    January 2014
    December 2013
    November 2013
    October 2013
    September 2013
    August 2013
    July 2013

    About

    This website was founded in July 2013.

    RSS Feed

    Categories

    All
    American Football
    Athletics
    Baseball
    Basketball
    Behavioural Economics
    Boxing
    Broadcasting
    Competitive Balance
    Cricket
    Cycling
    Darts
    David Butler
    Declan Jordan
    Drugs
    Ed Valentine
    Epl
    Esports
    Expenditure
    F1
    Fifa World Cup
    Finances
    Funding
    Gaa
    Gaelic Games
    Gambling
    Game Theory
    Gary Burns
    Geography
    Golf
    Greyhound Racing
    Guest Posts
    Horse Racing
    Impact Studies
    John Considine
    John Eakins
    League Of Ireland
    Location
    Media
    Mls
    Mma
    Olympics
    Participation
    Paul O'Sullivan
    Premier League
    Regulation
    Research
    Robbie Butler
    Rugby
    Simpsonomics
    Snooker
    Soccer
    Spatial Analysis
    Sporting Bodies
    Stephen Brosnan
    Swimming
    Taxation
    Teaching
    Technology
    Tennis
    Transfers
    Uefa
    Ufc
    World Cup
    Wwe

Powered by Create your own unique website with customizable templates.