The Economics of Sport
  • Sports Economics
  • About
  • Workshop
  • Selected Publications
  • Book Reviews
  • A Primer on Gaelic Games
  • Upcoming Events
  • Media
  • Education
  • Resources & Links

The Distribution of Premier League goals – A Cross Team Analysis

23/3/2018

 
By Sean O'Connor

With the pause in Premier League fixtures this weekend it is worthwhile to take stock of team performance so far this season. While examining the table it is clear that Manchester City have been the standout team, in terms of point’s accumulation. Their exciting brand of football has generally been lauded by the media and fans alike. In contrast, their nearest rivals, both geographically and within the league, Manchester United have been branded as playing a more conservative style of play under Jose Mourinho.

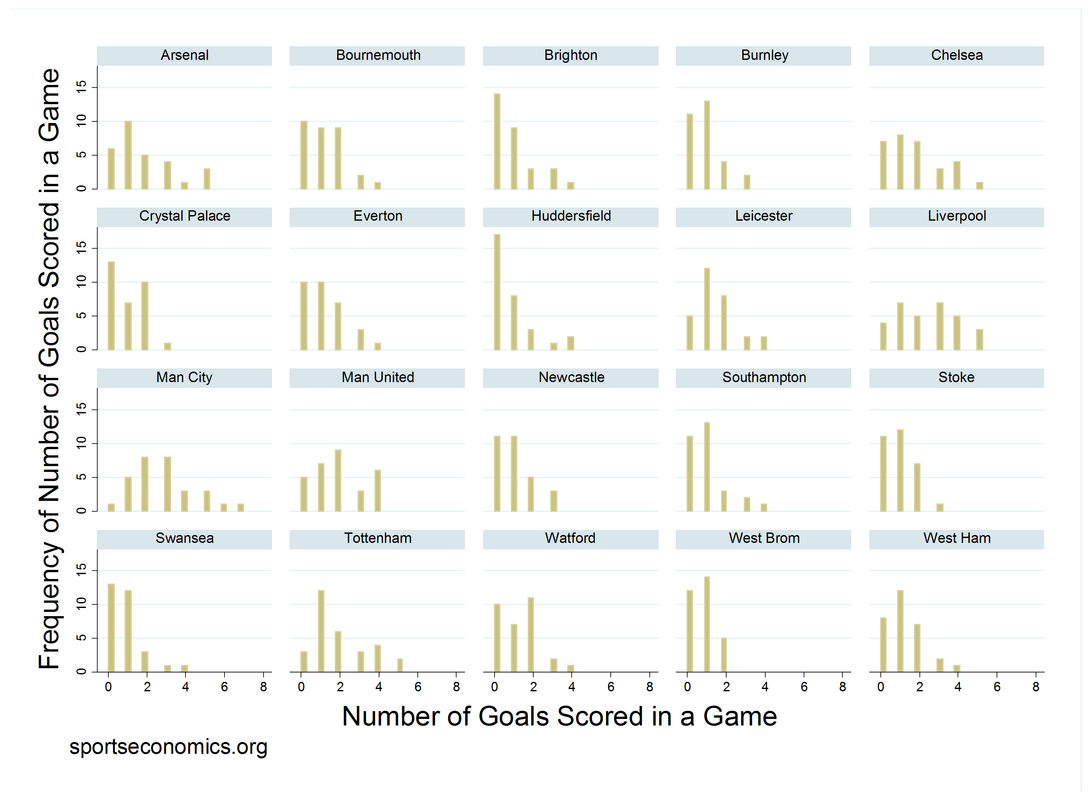
However, what does the data say, and what about the other 18 teams who make up the Premier League. What do their style of play look like? For this blog, we gather data for all Premier League results up to the 16/03/18. We create frequency plots of teams goals scored and conceded per game in order to examine team performance. Firstly we plot the number of goals scored by Premier League teams during a game and the frequency of the occurrence. The X-axis is the number of goals scored per game, while the Y-axis is the frequency of the occurrence.

Take Arsenal for example, they’ve failed to score in 6 Premier League games this season. In contrast Manchester City has only failed to find the net once. From examining the Figure below teams such as Brighton, Huddersfield and Swansea tend to have a high proportion of games were they don’t find the net. In contrast Liverpool and Arsenal, relative to other Premier League clubs, feature in games where they’ve scored 5 goals.

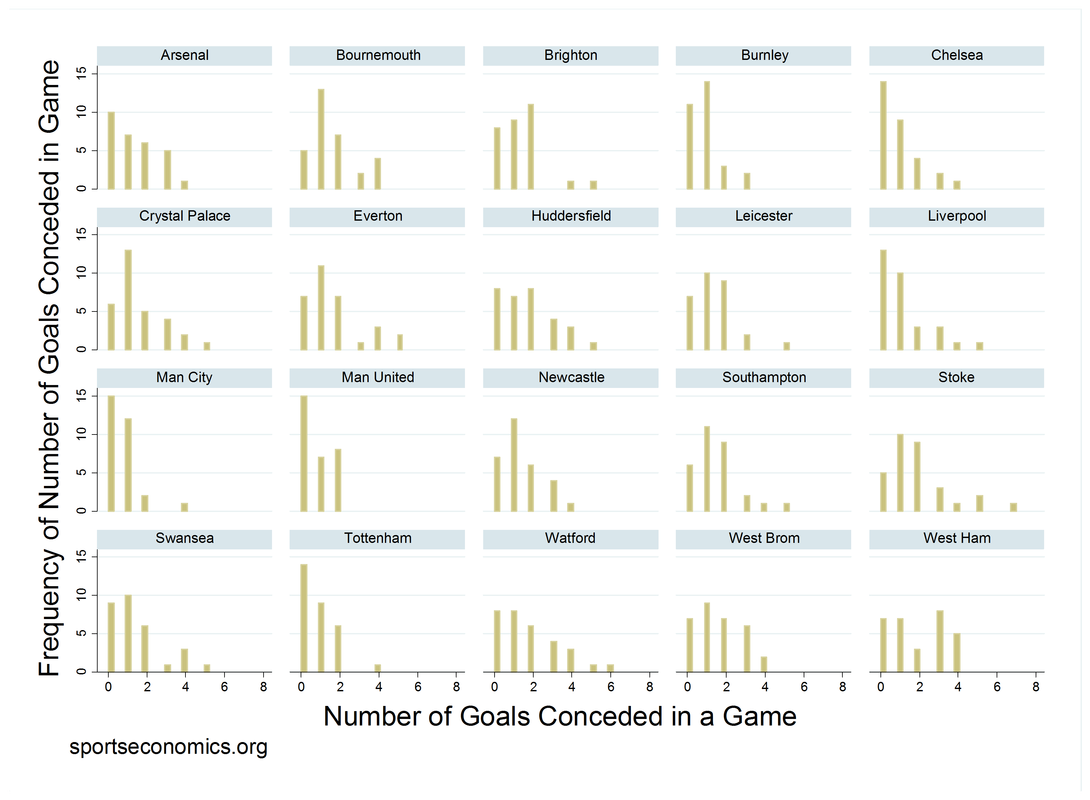
Plotting Goals conceded we see the formidable defences of the likes of Manchester City, Manchester United, Liverpool and Chelsea. Visualising the distribution of goals scored and conceded, along with the frequency of occurrence is a good way to understand the style teams adopt and the likelihood of a result when two teams play.

From examining both Figures presented below, we could summarise from the available data the general style Premier League teams have adopted this season. For example, if you’re hoping for a goal-fest between West Brom in their next fixture against Burnley chances are this is not going to happen, with them having failed to score over 2 goals all season. Moreover, generally teams only find the net once when they play Burnley.

A future blog will chart these types of distributions for other Leagues to attempt to shed some light how other teams styles of play compares. 

Picture
Picture

Why is Goal Difference Skewed?

21/3/2018

 
By John Considine
Looking at the Premier League table in early March 2018 I was a little surprised by the neat goal difference column.  The top six teams had a positive goal difference and the remaining fourteen had a negative goal difference.  When I pointed out this to some of the other contributors to this blog, there was little surprise.  They expected a skewed distribution of teams based on goal difference.  Further investigation revealed that their expectations were in line with the data.

I started by comparing the distribution of goal differences in other top European leagues.  On the morning of March 17th, the Spanish, French, German and Dutch leagues all had more teams with negative goal difference than positive goal difference.  The Italian league had an equal number of teams with a positive and negative goal difference.  (I treated zero as neither positive nor negative.)

Next I looked at the lower tiers of English football.  The second, third, and fourth tiers of English football all had more teams with negative goal difference than positive goal difference (as of the morning of March 17th).

Both of these comparisons were at a point in time.  The next comparison involved looking at the distribution of teams (by goal difference) over time.  The picture below shows the difference in the percentage of teams with positive and negative goal difference in the top tier of English football since the 1969-70 season.  I used the percentage because the number of teams in the top tier has varied from 20 to 22.
Picture
In only five of the seasons were there more teams with a positive goal difference than a negative goal difference.  Four of these occurred between 1987 and 1992.  This was a period where the league went from 22 teams to 21 teams and to 20 teams (before going back to 22 in 1992-93).  It was within a decade of the introduction of three points for a win (compared to two points previously).  There were other unusual features around this time period.  For example, the 1992-93 season was the inaugural Premier League season and in that season Norwich City finished 3rd with a negative goal difference.

Regardless of whether we look across (i) top flight of European football in 2018, (ii) the top four tiers of English football in 2018, or (iii) the top tier of English football since 1969-70, there are more teams with a negative goal difference than a positive goal difference.  This leaves me with the question: Why?

Cheltenham Festival 2018

11/3/2018

 
By Robbie Butler

As is normal for this week of the year, we turn our attention to Cheltenham. Over the past four years of this blog, I and others on this blog, have attempted to beat the market, with varying levels of success.

Since 2009 my record stands 3-6. I really need 2018 to be a good year as the bookies are getting away. 

In the past I have attempted to beat the market by selecting my own picks (and here), following the favourite, and backing Willie Mullins and Ruby Walsh ridden horses.

The only year of the four that was successful was when we followed Ruby. And we will do just that this year with a €2 stake on all Ruby Walsh ridden horses. The stake will be placed each way if the horse 5/1 or more. 

Daily updates to follow. 

**************************************************************************************************************************************
DAY 1

A very good start to the week. Ruby Walsh had 5 mounts on the opening day, resulting in a stake of €10. Two winners (Footpad (5/6) and Benie Des Dieux (9/2)) were registered. 

Stake Day 1: €10
Return: €14.67
Profit/Loss on Day 1: €4.67
Overall Profit/Loss: €4.67
Overall % Return on Investment: 46.7%
​
**************************************************************************************************************************************
DAY 2 

A disaster on day two as Ruby fractures his leg in the 2nd race, ruling him out for the week. Having finished 3rd in the first race yesterday, the official return on the day is;

Stake Day 2: €4
Return: €0
Profit/Loss on Day 1: -€4
Overall Profit/Loss: €0.67
Overall % Return on Investment: 4.79%

However, for the purposes on this exercise we can continue by assuming Ruby would have ridden the horses he was booked to ride and and include the two races he was present for (Races 1 and 2). 

Stake: €10
Return: €2.50
Profit/Loss on Day 2: -€7.50
Overall Profit/Loss: -€2.83
Overall % Return on Investment: -14.15%

For the final two days, will follow Paul Townend, the second string jockey of trainer Willie Mullins. Paul will ride the ride the horses Ruby Walsh would probably have ridden, and whilst not perfect, it will allow us to continue this study.

​**************************************************************************************************************************************
DAY 3

The third day proved to be an excellent one for Paul Townend. Four mounts returned two winner. Current state of play as follows:

Stake Day 3: €8
Return: €19.54
Profit/Loss on Day 3: €11.54
Overall Profit/Loss: €8.71
Overall % Return on Investment: 31.1%

**************************************************************************************************************************************
DAY 4

Five mounts on the final day did not herald a victory, and we had to make do with a second in the opening race at odds of 8/1. Final day and overall return as follows:

Stake Day 3: €10
Return: €2.60
Profit/Loss on Day 4: -€7.40
Overall Profit/Loss: €1.31
Overall % Return on Investment: 3.45%

The market is beaten for the 4th time in a decade. The score going into 2019 reads 4-6. 

Managing Expectations & The Republic of Ireland

9/3/2018

 
By Robbie Butler

This week Republic of Ireland manager Martin O’Neill announced a squad of 30 players for an upcoming friendly against Turkey. As one might expect, the squad is a mixture of regulars and new faces. While some argue about the merit of such friendlies at this time of the year, it is an opportunity to allow younger players to showcase their talents on the senior international stage. These fixtures also represent a passing of the guard. The likes of John O’Shea and Glenn Whelan have been part of the Irish set up since mid-2000 but are absent from 30 man list. Whether this will continue remains to be seen but there is a good chance we have seen the last of both in a green jersey. 

As Ireland will not compete at the World Cup in Russia this summer, eyes naturally turn the pending UEFA European Championship qualifiers. The draw for this takes place on the 2nd of December 2018 at the Convention Centre in Dublin. For the first time ever, Ireland will be hoping to secure qualification for the same tournament three times in a row.

While some regard qualification as a minimum requirement, others  are more pragmatic about reaching the finals of major competitions. The recent World Cup play-off defeat is an example. I for one was surprised Ireland reached the play-off stage. The country was the only Pot 4 nation to make it that far in the competition. While elimination at the hands of Denmark was particularly sore given the 5-1 defeat in Dublin, one should be conscience of the quality of our own squad as well as the opposition. The table below is worth considering. 

The rows 1990 to 2016 present descriptive statistics on approximate measures of player quality. These of course are only a guide and do not control for all factors. The data only applies to Irish internationals playing in England and covers the top 18 players in the squad for each of the major tournaments Ireland qualified for. Examples of missing players include Packie Bonnar (Celtic) John Aldridge (Real Sociedad) in 1990 and Robbie Keane (LA Galaxy) in 2012.

The column of data named "Cumulative League Rank of Players" is calculated based on the finishing league position of the club each player played for. For example, the squad of 1994 contained Dennis Irwin of Manchester United. Man United won the league that season so Irwin gets a value of 1. Roy Keane is also awarded a value of won. Terry Phelan played for Manchester City who finished 16th in the league. These three players therefore are 1+1+16=18. John Aldridge at the time played for Tranmere Rovers. The Merseyside club finished 6th in second tier of English football so Aldridge gets a value of 26, as there are 26 better 

The 2018 row presents data on the top 18 players, called into the squad this week, that have received at least one cap to date. All 30 play in England so no omissions are reported. 
Picture
​What does it tell us?

​For one, the Irish squad that qualified for the 2002 World Cup in Korea and Japan was arguably the best. A cumulative league position of the top 18 players added to just 195. That’s an average of 10.83. Effectively, this means the average player in the squad was a mid-table Premier League player. The lowest ranked player (Richard Dunne) played for the 21st best team in England (Manchester City) who had just won the Championship. The remaining 95% of the squad all played in the Premier League that season. Is it any wonder the team played its best football at a World Cup, scored more than a single goal in a game for the first time (3-0 win over Saudi Arabia) and reached the last sixteen of the competition? The team left Korea and Japan without losing a game in normal time or extra time.

Since then the trend has been downwards. The Euro Championship Finals squads of 2012 and 2016 were effectively Premier League teams just above the relegation zone (between 15th and 17th) . I would argue that qualifying for these finals was a very good achievement by both international managers.

In future it may be even more difficult. The most recent squad has a cumulative league position of 368. That’s nearly double the 2002 World Cup Squad. The highest ranked player (Jeff Hendrick) is 7th in the current Premier League table. The average player now plays for the bottom Premier League club (19.94). Just 9 (50%) of the top 18 players are Premier League players. These figures will probably improve once the qualifiers come around. Robbie Brady Darren Randolph, Stephen Ward and Richard Keogh will all make things better but even with these players included the average league position is 17.13.

Food for thought the next time you hear someone argue the team “should be doing better”.

The Southwell 13

6/3/2018

 
By David Butler

To my knowledge a new record was set at Southwell Racecourse last Friday when just 13 paying customers arrived at the track. The bitter cold and schedule reorganisation were offered as reasons for the surely record breaking turnout.  

The data on attendance at UK meetings from 1989 to 2015 shows that prior to Southwell last Friday, the previous lowest attendance was at Wolverhampton in December 2012. This meeting was held three days before Christmas – 111 showed up and only 5 bookmakers were present on course.

From 1989 to 2015, 952 UK meetings have attracted below 500 punters. The data shows that 644 (67%) of these were held at Wolverhampton racetrack. Southwell held the second highest percentage of meetings with under 500 attendees - 123 meetings (19%). Along with Lingfield, these meetings at these tracks appear to be designed for bookmakers shops and off-course bettors rather than racegoers. It is also the case that the vast majority of races run at these tracks are on an all-weather surface. Wolverhampton Racecourse only hosts all-weather events on its recently installed Tapeta surface.

The weather, and perhaps the Christmas season, appear to be important regulators for meetings in this <500 club too. The chart below shows the data by month for the 952 meetings. Typically, these events fall into months with adverse weather conditions. While not denying the importance of race quality and facilitates,, this might be something authorities need to consider more when organising the racing calendar to help smaller racetracks improve attendances. That is of course, if the motivation is to attract greater attendances.
Picture

Changes to Competition Structure in the Champions League

5/3/2018

 
By Robbie Butler

There were some recent changes in the competition structure of the UEFA Champions League that is good news for the big four leagues of Spain (1), Germany (2), England (3) and Italy (4). From next season (2018/19) all four leagues will have a guaranteed four places in the Group Stage of the competition.

Fans of the Premier League will be familiar with the 4th placed team having to navigate, a sometimes tricky, play-off round at the start of each new season. For example, this season Liverpool had to overcome German club Hoffenheim in a two-leg playoff in August before entering the group stages.

Since 2009-10 this route has been more difficult than before, as clubs from the bigger leagues must go down the "League Path" to qualify. This is different to the "Champions Path". The Champions Path is for clubs that win their respective leagues but do not automatically qualify for the Group Stages. By definition these are weaker clubs from weaker leagues, but have the advantage of playing one another in order to qualify. This is largely the reasons clubs from Cyprus, Hungary and Slovakia have reached the last 32 of the competition.

However, the new competition structure is reducing the number of teams that can qualify from the Champions Path from 5 to 4. This is particularly bad news for League of Ireland clubs. The last 32 of the competition continues to remains elusive for clubs on this island (both North and South) and despite some near misses (Shelbourne and Dundalk) next years' competition will be even harder to get to.

The new rules are also bad news for UEFA leagues ranked 11 and 12 (currently Czech rep and Switzerland) as the champions of both leagues, normally guaranteed qualification to the last 32, will now need to come through a play-off. 

It seems as if the bigger leagues are fighting back, and concessions made in 2009/10 are in reverse somewhat. As David pointed out last September there is clear balance issues with the Champions route. 

Potential Effects of Moving the Transfer Deadline Back

2/3/2018

 
​By David Butler

It was recently announced that transfer (registration) window will close for all English football league clubs on 9th August at 5.00pm. The window for EFL clubs is now synchronised with the Premier League, who have collectively chosen to close the window two days before the 18/19 season starts. This is well before the window shuts for the rest of Europe.

As the true valuation clubs place on players is often only revealed at the eleventh hour, supporters have become accustomed to seeing a deadline effect. Last minute deals are often cut as bargaining power shifts close to a deadline. A chain reaction usually occurs as one deal begets another; clubs won’t sell without a replacement. I would guess that this behaviour, and all the associated hype, will just be moved backward three weeks.

There might be some subtle and some unforeseen effects however. This could go two ways. Pushing the deadline back may make things more frantic, particularly during years where international competitions take place. In turn, this could increase the frequency of business in the January window. Oppositely, it may stop panic buys which can occur under the current rules. At the moment clubs can overpay after a bad start.

Moving the transfer window backward may alter the ‘deadline day’ activity in other ways too. The buying-selling dynamic of the window will likely change as clubs will still have plenty of time to offload players abroad.  Will we see more last minute splurges as clubs still have an extra few weeks to flog unwanted talent on the continent? Perhaps. Equally, it will present a challenge for elite clubs who have players in demand from the European giants – top Premier League clubs may have to work harder to fend off Barcelona, PSG, Real et al. While these situations are rare, clubs won’t be able to reinvest any monies accrued from a sale after the domestic window closes.

While the craziness could be just pushed back three weeks, the negative externality associated with unruly players trying to push through a move will likely end. Managers who crave stability could be the winners. By voting for the new rules clubs seem to be willing to sacrifice a star player who could be useful, albeit for 3-4 matches, for the sake of certainty and having no disruptive forces existing in the dressing room.

Recently, Sanchez, Costa, Coutinho and van Dijk were withdrawn from the first eleven as speculation mounted about their future. A good example prior to this year’s start was the case of Gylfi Sigurdsson. The Icelander wasn’t in the ‘right frame of mind’ to go on Swansea’s pre-season tour. He moved to Everton on the 16th of August. One of the most famous examples occurred in the 2008/2009. The atmosphere at Tottenham was close to toxic for the first few matches as the benched Dimitar Berbatov (successfully) forced through a move to Manchester United on deadline day. Tottenham scored 1 point out of 9 before the window closed. Juande Ramos was sacked soon after. The Berbatov transfer debacle did him no favours.

Moving things back will allow inevitable transfers to take place earlier and may negate any dressing room spillover effect associated with want-away stars. Also, increased squad certainty may improve parity between clubs. If negative effects caused by one individual spreads across a dressing room, another club may luckily play them in the first few weeks, prior to the windows close. Hopefully an early close will stop teams randomly benefiting from an unsettled opposition.  Finally, moving things back may do away with any perverse incentives stories (or conspiracy theories that surface online). For instance, Oxlade-Chamberlain represented Arsenal in Liverpool ‘s 4-0 win. A week later he joined the Merseyside club.

It will be interesting to see the effects of this change. Something in me thinks that without the buy in of other European leagues, the desired impact of the rule change may not be fully reached. If anything, big European leagues could see the Premier League's first move as giving them leverage in the transfer market. 

    Archives

    June 2025
    May 2025
    April 2025
    March 2025
    February 2025
    January 2025
    December 2024
    November 2024
    October 2024
    September 2024
    August 2024
    July 2024
    June 2024
    May 2024
    April 2024
    March 2024
    February 2024
    January 2024
    December 2023
    November 2023
    October 2023
    September 2023
    August 2023
    July 2023
    June 2023
    May 2023
    April 2023
    March 2023
    February 2023
    January 2023
    December 2022
    November 2022
    October 2022
    September 2022
    August 2022
    July 2022
    June 2022
    May 2022
    April 2022
    March 2022
    February 2022
    January 2022
    December 2021
    November 2021
    October 2021
    September 2021
    August 2021
    July 2021
    June 2021
    May 2021
    April 2021
    March 2021
    February 2021
    January 2021
    December 2020
    November 2020
    October 2020
    September 2020
    August 2020
    July 2020
    June 2020
    May 2020
    April 2020
    March 2020
    February 2020
    January 2020
    December 2019
    November 2019
    October 2019
    September 2019
    August 2019
    June 2019
    May 2019
    April 2019
    March 2019
    February 2019
    January 2019
    December 2018
    November 2018
    October 2018
    September 2018
    August 2018
    July 2018
    June 2018
    May 2018
    April 2018
    March 2018
    February 2018
    January 2018
    December 2017
    November 2017
    October 2017
    September 2017
    August 2017
    July 2017
    June 2017
    May 2017
    April 2017
    March 2017
    February 2017
    January 2017
    December 2016
    November 2016
    October 2016
    September 2016
    August 2016
    July 2016
    June 2016
    May 2016
    April 2016
    March 2016
    February 2016
    January 2016
    December 2015
    November 2015
    October 2015
    September 2015
    August 2015
    July 2015
    June 2015
    May 2015
    April 2015
    March 2015
    February 2015
    January 2015
    December 2014
    November 2014
    October 2014
    September 2014
    August 2014
    July 2014
    June 2014
    May 2014
    April 2014
    March 2014
    February 2014
    January 2014
    December 2013
    November 2013
    October 2013
    September 2013
    August 2013
    July 2013

    About

    This website was founded in July 2013.

    RSS Feed

    Categories

    All
    American Football
    Athletics
    Baseball
    Basketball
    Behavioural Economics
    Boxing
    Broadcasting
    Competitive Balance
    Cricket
    Cycling
    Darts
    David Butler
    Declan Jordan
    Drugs
    Ed Valentine
    Epl
    Esports
    Expenditure
    F1
    Fifa World Cup
    Finances
    Funding
    Gaa
    Gaelic Games
    Gambling
    Game Theory
    Gary Burns
    Geography
    Golf
    Greyhound Racing
    Guest Posts
    Horse Racing
    Impact Studies
    John Considine
    John Eakins
    League Of Ireland
    Location
    Media
    Mls
    Mma
    Olympics
    Participation
    Paul O'Sullivan
    Premier League
    Regulation
    Research
    Robbie Butler
    Rugby
    Simpsonomics
    Snooker
    Soccer
    Spatial Analysis
    Sporting Bodies
    Stephen Brosnan
    Swimming
    Taxation
    Teaching
    Technology
    Tennis
    Transfers
    Uefa
    Ufc
    World Cup
    Wwe

Powered by Create your own unique website with customizable templates.