The Economics of Sport
  • Sports Economics
  • About
  • Workshop
  • Selected Publications
  • Book Reviews
  • A Primer on Gaelic Games
  • Upcoming Events
  • Media
  • Education
  • Resources & Links

The distribution of GAA Grants – Variations in Time

27/11/2017

 
By Sean O'Connor

Continuing the recent trends of analysing Irish sports capital grants, today we focus on a decile distribution of grants awarded to GAA teams.

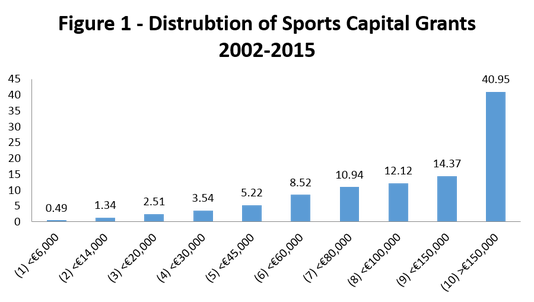
Focusing on the bottom and top deciles, we note over the period a decrease in funding awarded to the bottom and top ten percent of GAA clubs. The table below can highlight some interesting points to how grants towards GAA clubs have been distributed over the years. For instance, in 2002, in relation to grants for GAA clubs circa 27 clubs were awarded 29% of the overall funding (circa €7,000,000). In 2008 this distribution was at its most skewed where circa 23 clubs received a third of the overall funding awarded for GAA grants.

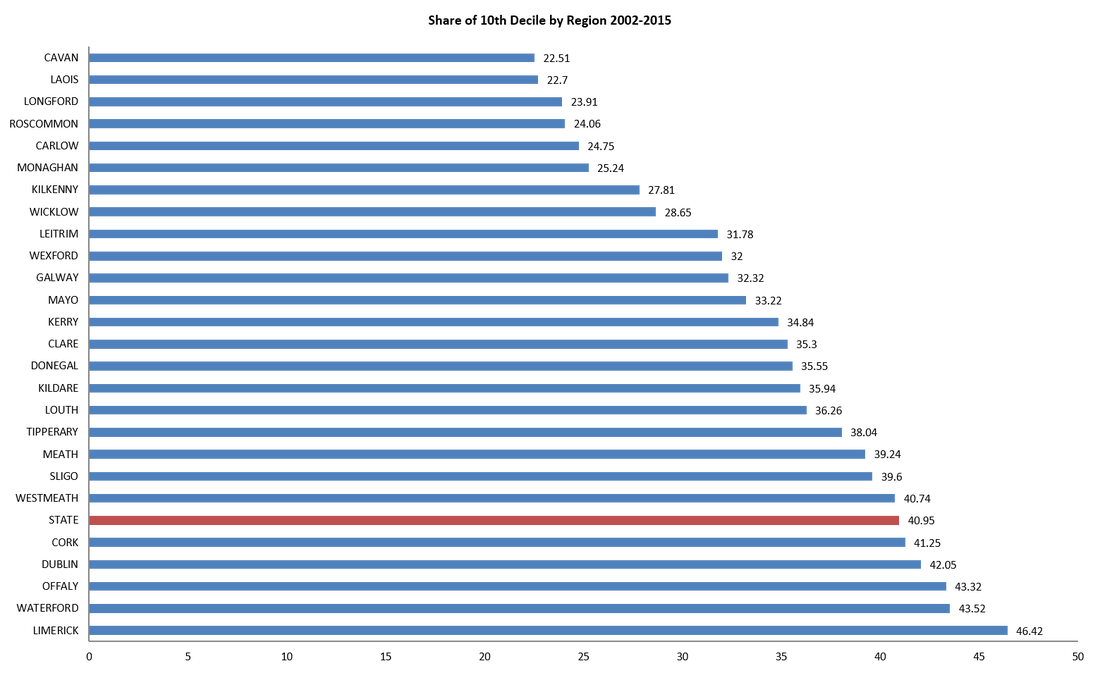
In 2007 the monetary award was at its greatest where a total of €33 million was given out to GAA clubs. In this period, circa 37 clubs received circa €9 million in funding or 27.28% of the entire available funds. A follow up piece to this will examine the distribution across region over the entire period, along with a look at some other sporting codes. 

Picture

Nationality & Premier League Management

24/11/2017

 
By David Butler

With the Premier League managerial churn back in full swing, I’ve seen several UK commentators on TV and online revisit one of their favourite topics – the need to promote British managers. This topic usually lurks behind the question of ‘who should be next for the job?’

Similar to player-level labour migration patterns in the Premier League, most managerial imports have also come from other EU countries.  Wenger, Mourinho, Conte, Mancini and Ranieri are just some examples of successful managerial imports.

The data below considers the nationality of Premier League managers (at the end of season only, and doesn’t consider changes) since the league became a 20-team competition in 1995/1996.  The first chart shows a count of only English managers, the second takes a regional perspective, showing managers from other UK countries and the Republic of Ireland. The final graph shows the growing number of managers to come to English shores from (mostly) EU and non-EU countries.  

At the end of the 1995/1996 all Premier League managers were from the UK and Republic of Ireland. As the league internationalised the share of English managers, and those from the surrounding region, has fallen. Since the end of the 2012/2013 season there has been almost a 50/50 split, if the topic is considered as regional managers vs. ‘rest of the world’ managers.

While discussing whether English or ‘regional’ managers ought to be given more opportunity is a thorny issue, loaded with political connotations, it’s hard to escape the idea that the Premier League has been a victim of its own success when it comes to the decline of the English 'gaffer'.
Picture
Picture
Picture

Bundee Aki and what it means to be Irish

22/11/2017

0 Comments

 
by Declan Jordan
Picture
The Irish rugby team is currently two games into their three game Autumn Series, with victories over South Africa and Fiji. The final game is against Argentina this coming Saturday. A lot of attention has focused on the inclusion in the Irish squad, and the team for the opening game against the Springboks, of Bundee Aki. He plays for Irish provincial side Connacht and qualifies to play for Ireland through the residency rule. This rule allows players to represent a country if they have lived in that country for three years.

The period of residency will extend to five years from 2020.

Neil Francis, a former Irish international and now a media analyst, was very vocal in his criticism of the selection of Aki. He wrote “It is wrong, irrespective of how good he is, that an Irishman born and bred here should sit on the sideline while somebody who has no connection whatsoever with this country, other than drawing a large wage, takes his place”. He also said “The prime criteria for being selected to play for Ireland is that you be Irish above all other things. You can be committed to the cause, but you can be paid to be committed to the cause. You can learn the anthem. You can die for the jersey. Pick a jersey, any jersey and I will die for it. You can quote rule 8 to me as long as you like but you can't trade out your heritage”.

Ewan McKenna wrote that the residency rule is a form of financial doping.

Bundee Aki is not the first player to qualify and be selected by Ireland under the residency rule. CJ Stander’s and Jared Payne’s inclusion have also been questioned. In the Irish squad for the Autumn Series there are several Irish players born outside of Ireland. It’s unclear where this leaves Neil Francis’ suggestion that we should always favour an “Irishman born and bred”. As well as Stander and Aki, those born outside of Ireland include Ultan Dillane, Kieran Treadwell, Joey Carbery, Kieran Marmion, CJ Stander, and Rob Herring. Some have Irish parents and came to Ireland when young, such as Dillane and Carbery. Treadwell and Marmion have Irish parents but did not go to school in Ireland.

There are at least two issues being raised here. The first is what makes somebody Irish. Is a player born in, say, the US whose grandfather left Ireland as a child and who has never visited Ireland ‘more Irish’ than a player who has chosen to spend a substantial portion of his career in Ireland, married an Irish person, and raising a young family born in Ireland? The latter case describes Jared Payne. Identity is becoming a more complex concept as the world becomes more integrated. There is no clear way of defining Irishness, and it is getting even more difficult.

Second is the issue of “financial doping”. This is alarmist. Doping is associated with rule breaking. There are no rules being broken. The residency requirements apply to all countries and many countries use them more than Ireland. The difficulty in individual cases means it is good for World Rugby to set clear rules on eligibility.
​
There is a more worrying development into which the furore over “heritage” and “Irishness” feeds. Ireland is a small country with a large diaspora. There are Irish people all over the world. Many families were forced to leave Ireland to get jobs and/or to escape a repressive social climate. Should their children and grandchildren be considered less Irish than the descendants of those who remained? The Irish football team has a long history of selecting players (in line with the rules on eligibility from FIFA) who have at least one Irish grandparent and have no other connection with the country. In the recent squad for the play off against Denmark, 10 of the 26 players were born outside of Ireland.

Scott Hogan is the most recent new recruit that fits that bill. In Irish football there has rarely been any controversy that these players are less Irish than those born here. However, Cyrus Christie has revealed the racist abuse he has received following Ireland’s disappointing defeat against Denmark in the World Cup playoff. He has revealed this has been going on throughout the campaign and includes calls for him to go back to “where he came from”. It is telling that white players born outside Ireland are not told that.

The terms of ‘heritage’, ‘blood’, and ‘born and bred’ being used in reference to a player’s chosen identity open the door to those who feel some, because of their ethnicity, are less than Irish. If a player chooses to play for Ireland we should welcome him or her as one of our own.

0 Comments

Integrity and Non-Runners

20/11/2017

 
By Robbie Butler

In recent days, English trainer Nicky Henderson has come in for criticism for his alleged delay in informing the public of the setback that star chaser Altior had in preparation for the upcoming Tingle Creek Chase at Sandown.

This central issue, and the main source of this criticism, concerns the integrity of the ante-post betting market. For those unfamiliar with horse racing, ante-post markets allow one to bet on a race in the weeks and months prior. Larger prices are offer but these are offset by the greater level of risk. If a horse fails to run, money is not returned. This is not the same as betting on the day of a race, where punters are refunded for non-runners.

The issue of non-runners appears to becoming a matter of debate with some questioning the timing of these. The Turf Club in Ireland produce some excellent data, available online, which sheds light on non-runners in Ireland. The most recent publication covers the 2012-2016 period.

The number of non-runners in Ireland has decreased over the past five years. 2,126 non-runners were reported in 2012 compared to just 1,863 in 2016. This is slightly up on the previous year when 1,607 horses failed to run after being declared.

Some of the drop can be put down a decline in the number of horses in training. However, given a total number of runners over the past 5 years, the percentage of non-runners is relatively stable between 6% and 7%. Ireland it seems does not have a major issue on this front.

The reason for declaring a non-runner is also provided. Almost 40% are down to ground conditions. Lameness is the next more common reason for withdrawal with between 9.8% and 17.4% of horses not running for this reason. Coughing and stone bruises account for around 10% each respectively. The remaining 30% are down to variety of other reasons such as a temperature, being off-feed or injured.

The full document and data can be found here. 

Population & Points Total - 2018 FIFA World Cup qualification (UEFA)

15/11/2017

 
By David Butler

Earlier this week the Economist newspaper told the now quite well-known story behind the rise of Iceland. The article is called “How Iceland (population: 330,000) qualified for the World Cup”. In short, it’s a story of investment and good organisation. Pouring resources into infrastructure such as artificial surfaces for schools and upskilling coaches, coupled with some savvy tactics, has steered Iceland to another major international competition.

The population figure stood out the most for me. With that in mind, I plotted the relationship between male population levels (log) for UEFA entrants and the amount of points earned over the 2018 UEFA World Cup Qualification phase.
​
The graph considers 53 entrants from the UEFA confederation. The population data was accessed from Eurostat and official labour market statistics for the individual UK countries. The population figures represents the male population level for 2016. 
Picture
I've included some flags on the map to give an indication of some of the countries. Germany has the highest possible pool to select from (40,514,123) and has also scored the highest of points this campaign – 30. Having access to a big pool and high levels of investment usually translates to success.

As for ourselves, Ireland totalled 19 points from a population of 2,335,733 males. Northern Ireland, also reached 19 points with just a population of 232,804 – that’s not far behind Iceland.

You’d have to be worried for the minnows that failed to earn a point. San Marino, Liechtenstein and Gibraltar will probably always struggle, saving a significant population growth; they select a squad from a pool of under 20,000 men.  
For Iceland, Eurostat reports a male population figure of 167,270. For a 23-man World Cup squad, approximately one in every 7,000 Icelander has a chance of making it! Population is clearly important but the Iceland story reminds us that this is not an iron relationship. 

Tough Starts and Extrapolating Current Form

13/11/2017

 
By Diarmuid Gillingham

Diarmuid is a final year undergraduate student at University College Cork and is currently registered in EC3219 - The Economics of Sport. @Diarmuid_mufc​. 

It is often said the first ten games of the Premier League season are a great indicator on how the league will finish the following May. So, with Game Week 11 having come to an end and the November international break upon us, I decided to have an in-depth look at the Premier League table and in particular the top 6 as it stands, and see what it tells us. The table below sheds light on the performance of Arsenal, Chelsea, Liverpool, Manchester City, Manchester United and Tottenham. 
Picture
Points Totals
It goes without saying that Manchester City have started this season as by far the most reliable team. A perfect record except for a 1-1 draw at home to struggling Everton. At 31 points, the blue side of Manchester have gained an extra 7 points compared to last season and jumped two places. Over on the red side of Manchester, United have also seen progress. Despite poor results recently the Red Devils have risen four places due to obtaining an extra 5 points than at the same stage last season. Tottenham have climbed two spots to third, achieving two extra points despite poor early season form at Wembley. Champions Chelsea have three fewer points and therefore have dropped two places. Liverpool have seen the most significant fall from grace. They found themselves currently on 19 points, 7 points, and four spots worse off than the same stage last season. Finally, Arsenal dropped to 6th this season compared to 4th at the same stage the previous year. They have five fewer points less this time around. 


Average Position of Teams Faced
There is very little difference between the top 6 regarding the standard of teams they have faced. The mean position of teams faced by all the top 6 is between 9th and 12th. Saying that, claims that Manchester United have had an easier start to the season than their fellow top 6 clubs are backed up, as they have faced the lowest level of competition so far, based on league position. On the other hand, both Chelsea and Liverpool fans can look forward to a slightly easier run towards the halfway mark than the other top 6 clubs.
 

Games Played against the Top 6
Based on the results in the table (average position of teams faced) it should come to no surprise that both Chelsea and Liverpool are the only members of the top six to have played four other members. While both Manchester clubs, Tottenham and Arsenal have only played three. Despite this, Arsenal can easily claim to have had the hardest start with all 3 of their games against fellow top six opponents, (Manchester City, Liverpool, and Chelsea) coming away from home. With a return of only one point, coming at Stanford Bridge. While Chelsea have played four games against the top six, three have come at home. Most recently against Manchester United. United themselves have only had one game at home. A 1-0 win against a Tottenham side minus top goal scorer Harry Kane. Both Tottenham and Manchester City have played 66% of their top 6 games at home. Manchester City have taken full advantage of this beating Arsenal 3-1 in match week 11 and beating a sorry Liverpool, 5-0. Liverpool are the only side with a perfect 50-50 ratio but have struggled against big teams compared to last season.
 
 
Points Totals

If Manchester City continues at their current rate, they will win 107 points by the end of the season. 12 points more than the record 95 achieved by Jose Mourinho at Chelsea. It would also mean a non-existent title race. With Manchester United and Tottenham finishing on 79 points. An 18-point gap, meaning City would win the league with at least five if not six games to spare. There would also not be much of a race for the top four as Liverpool in 5th would finish 10 points behind 4th place, Chelsea. Many see the Premier League as the most exciting football league in the world. But right now, that is just not the case. At current rates the league risks having only a relegation battle to talk about as the league season reaches its final few hurdles. This claim is further back up by the fact that on current form joint second place Manchester United and Tottenham would have finished 3rd last season, while 5th place and top four chasing Liverpool would have finished 7th.  

A Defeat Is Never Better Than A Draw

10/11/2017

0 Comments

 
By Robbie Butler

I had an interesting discussion with some friends regarding Ireland’s upcoming first leg play-off match with Denmark in Copenhagen tomorrow evening. It was interesting because one in our group suggested that a 2-1 defeat would be more preferable than 0-0, insisting that an away goal was vital for Ireland.   

I spent the next 15 minutes attempting to convince him that a defeat is never more advantageous than a draw. I don’t believe I changed his mind.

I have come across the psychology behind this view before in different guises; it follows that Ireland will play better if ‘we know what we have to do’, however a draw tomorrow night will be better than any version of a loss.

To put some logic on this, let’s consider an example and assume that the most either team can win or lose by is four goals. For Ireland the best outcome is a 4-0 win. This is followed by 4-1, 3-0, 4-2, 3-1, 2-0, 4-3, 3-2, 2-1, and finally 1-0.

The next best outcomes are all draws, the best being 4-4, then 3-3, 2-2, 1-1 and finally 0-0. The higher draws are more desirable as Ireland score more away goals. These are important but only as a secondary criteria. Away goals only become relevant if the number of goals over both legs are tied.

Assuming Ireland lose 2-1 tomorrow night, the team MUST score in Dublin and also MUST win in order to progress. This constraint cannot be better than a 0-0 in the 1st leg. Assuming 0-0 were to happen, Ireland could progress by neither scoring nor winning (qualify via penalties). 

And that is only the Ireland side of the story. Maybe this is why people can make this mistake. They focus solely on Ireland and ignore Denmark's strategy.

Should Denmark win 2-1 tomorrow, rather than draw 0-0, the Danes could actually qualify in Dublin with any match outcome (win, draw or loss). Any win or draw would be enough, so too would a 2-3 or 3-4 defeat. If the game ends 0-0 tomorrow, any loss in Dublin on Tuesday night would see Denmark eliminated. 

While an away goal is important, don’t be fooled into the belief it is more important than the match outcome. It isn’t and never will be.
​
COYBIG!
0 Comments

Sports Capital Grants – The Ten Presenters

8/11/2017

0 Comments

 
By Sean O'Connor

My last few pieces on this blog (here and here) have focused on the distribution of Ireland’s sports capital grant funding over the period 2002-2015. We’ve examined the breakdown in terms of inequality; nationally, regionally and also amongst different types of sports. Today’s piece will delve further into the distribution of capital grants, utilising the share amongst the deciles to highlight how much income is received by the bottom, as well as top ten percent.

Deciles are a simple way to measure income inequality within a country. Simply put they can be utilised to examine how much of total income in a country/region is earned by those in the lowest wage earning groups and those in the highest wage earning bracket. The deciles split the population into equal groups of ten and look at the share of income within each group. To begin Figure 1 provides the breakdown of the deciles over the entire period.
Picture
Figure 1 indicates clubs who received grants of €6,000 or less would be grouped into the lowest decile, whereas clubs who received grants in excess of €150,000 would be in the top. Given the total number of clubs who received funding during the period was 7,615; each group or decile consists of circa 761 recipients or sports clubs. Interestingly from examining Figure 1 the bottom 761 clubs who received grants of less than €6,000 over the period, accounted for 0.5% of the total cumulative share of awards given out. Conversely, the top ten percent of recipients accounted for 41% of the total value of grants awarded over the period. In other words, in total, 761 sports organisations received circa €231,000,000 worth of funding between them, or on average €312,022 per recipient. Figure 1 would point to the fact much of funding distributed over the period is concentrated in a number of large grants given to a small number of clubs. Given this, it’s also worthwhile to examine how this distribution alters from year to year. Therefore, Table 1 examines the distribution amongst the deciles from each period.
Picture
Table 1 presents information of the distribution of sports capital grants per year and across deciles. The row signified by N refers to the number of grants given out to individual clubs during the period, while the row marked value refers to the total amount funding given in that year. So in 2002, 837 individual grants were given out with a total value of €75,400,000. Interestingly, the cumulative share of grants for the bottom ten percent of clubs never once reached one percent. Contrast this to the top ten percent of clubs who in any given year received close to two thirds of the available funding. In particular years this distribution was even more extreme. For instance, in 2003 circa 61 clubs received 42% of the overall funding available (€51,900,000), whereas in 2008 68 clubs took over half the funding available in that particular year, while the top 1% in 2008 took 18.55%. It’s also interesting to look at share of funding of the top ten percent across different counties. Figure 2 plots this for each county over the entire period.
Picture
The red line in Figure 2 denotes the share of grants received by the top ten percent of recipients nationally over the period, whereas each blue bar highlights the share of the top ten percent within each county over the period. We notice five counties are above the national average over the period in terms of the share of grants received by the top ten percent of clubs. These regions are Waterford, Offaly, Limerick, Dublin and Cork, with the impact being most pronounced in Limerick. While such an analysis sheds further light on the distribution of Irish sports capital grants, a follow up piece on this blog will provide a breakdown of the distribution of grants across the deciles for a number of different sporting codes. 
0 Comments

Irish Household Sports Expenditures – Livelihood status.

6/11/2017

 
By John Eakins

Continuing my series of blog posts on Irish Household Sports Expenditures (previous posts here and here), the following looks at livelihood status of the household reference person (HRP). Livelihood status is categorised in the Household Budget Survey (HBS) as follows: self-employed, retired, employee, unemployed and other (including students and those on homes duties). The table below shows the shares of each group in the 2009-10 and 2015-16 Household Budget Surveys (HBS).
Picture
As can be seen, the proportion of employed HRP’s has increased as the economy has recovered. This has led to a reduction in the proportion of unemployed and other livelihood status HRP’s. The increase in the proportion of employed HRP’s is offset somewhat however by an increase in the proportion of retired HRP’s. In the context of sports expenditures, such trends are interesting because of the assumption that leisure time and work time are substitutes for one another. Thus the increase in the proportion of employed HRP’s may (possibly) lead to a reduction in the time spent on sport/leisure for this category. Equally the decrease in the proportion of unemployed and other livelihood status HRP’s may also (possibly) lead to a reduction in the time spent on sport/leisure for these categories. In contrast, retired HRP’s with more time on their hands may increase their leisure consumption.

To explore this further, the graphs below show weekly expenditure data for the 4 categories of sports analysed in previous blog posts by livelihood status using both the 2009-10 and 2015-16 HBS data (Note again that the 2009-10 expenditure data has been deflated to provide a more appropriate comparison).
Picture
Our assumption appears to hold for spectator sports, with decreases in weekly expenditures for employees and the unemployed and increases in retired expenditures. In previous blogs I suggested that spending on spectator sports were particularly influenced by economic conditions but the fact that the expenditures of retired HRP’s has increased between the two surveys may indicate that time also plays a role.

For the other three expenditure categories, there are increases across all livelihood status, significantly so for participant sports and subscriptions to sports and social clubs and less so for fees to leisure classes. The leisure time and work time trade off assumption therefore does not appear to hold for these items. Thus even though there have been increases in work time (i.e. increases in the proportion of employees), there have also been increases in spending on participant sports and subscriptions to sports and social clubs in particular. I previously speculated that the level of increase in these categories could be due to increased awareness of health benefits and shift in preferences from work to leisure time. The data here seem to support this.

Of course, I’m making somewhat of a leap in equating spending with time. There could be a lot of people spending money on sports/leisure but not the time (although there could equally be a lot of people spending time on sports/leisure but not the money so one may cancel out the other). But the figures are positive and do suggest that people are finding time for both work and leisure reflecting a view that both can be complementary rather than substitutes for one another.

Home Advantage in Team Golf

2/11/2017

 
By John Considine
Recently, I was listening to an interview with Ryder Cup winning captain Paul McGinley.  During the course of the interview, McGinley made a reference to the importance of home venue for team golf tournaments.  He implied that it is very important in 2017 and gave a statistics that 80% of winners are the hosts.  McGinley's observation raises an interesting point about home advantage that is worth highlighting for sports economics - home advantage in team golf is unlikely to be channelled through the referees/umpires.

Below is a graphic that illustrates the proportion of team golf titles held by the host team.  Just over 64% of the titles were held by teams that won them at home.  McGinley's claim is supported by the data.  The tournaments included in the calculation are: the Senior and Junior Ryder Cups; the Senior and Junior Solheim Cups; the Presidents' Cup; the Arnold Palmer Cup; the Curtis Cup; Walker Cup; and the Men's World Cup of Golf.  The inclusion of the last of these tournaments is questionable as there are more than two teams competing and, therefore, a home win is less likely.  As many of the tournaments are held only every second year, the calculation is based on the current holder of the tournament.
Picture
It is very difficult to see how home advantage in golf could be the result of refereeing decisions.  On the surface it would seem that if the raucous support for a home team in Ryder Cup has an influence then it is through the players rather than the officials.  Do economists over emphasis the role of the referees/umpires?  In a 2011 post, Stephen Dubner wrote a blog post on "Football Freakonomics" where he seemed to approve of the view that referees were the most important influences in home-field advantage.  Dubner made reference to the arguments from a book called Scorecasting by Moskowitz & Wertheim.  However, saying that there is a bias in refereeing decisions is not the same as saying they are the best explanation of home-field advantage.  In addition, it is possible to interpret the research by Moskowitz & Wertheim a little differently (as I did here and provide further evidence as I did here).

There is some evidence to show that when it comes to refereeing decisions, there can be a bias towards the home team.  Some evidence.  However, there is also evidence to the contrary.  The Butler brother of this parish have found little evidence of home bias in the decisions about added-time (here).  Hlasny & Kolaric struggled to find evidence of home bias in disciplinary matters in a recent Journal of Sports Economics paper (access their paper here or my review of it here).

My disposition is probably to accept that there is possibly some home bias in refereeing decisions.  I'm not sure if it is a product of my economics training, my sporting experience, or my personality.  However, the home advantage that teams have in golf makes me wonder.

    Archives

    May 2025
    April 2025
    March 2025
    February 2025
    January 2025
    December 2024
    November 2024
    October 2024
    September 2024
    August 2024
    July 2024
    June 2024
    May 2024
    April 2024
    March 2024
    February 2024
    January 2024
    December 2023
    November 2023
    October 2023
    September 2023
    August 2023
    July 2023
    June 2023
    May 2023
    April 2023
    March 2023
    February 2023
    January 2023
    December 2022
    November 2022
    October 2022
    September 2022
    August 2022
    July 2022
    June 2022
    May 2022
    April 2022
    March 2022
    February 2022
    January 2022
    December 2021
    November 2021
    October 2021
    September 2021
    August 2021
    July 2021
    June 2021
    May 2021
    April 2021
    March 2021
    February 2021
    January 2021
    December 2020
    November 2020
    October 2020
    September 2020
    August 2020
    July 2020
    June 2020
    May 2020
    April 2020
    March 2020
    February 2020
    January 2020
    December 2019
    November 2019
    October 2019
    September 2019
    August 2019
    June 2019
    May 2019
    April 2019
    March 2019
    February 2019
    January 2019
    December 2018
    November 2018
    October 2018
    September 2018
    August 2018
    July 2018
    June 2018
    May 2018
    April 2018
    March 2018
    February 2018
    January 2018
    December 2017
    November 2017
    October 2017
    September 2017
    August 2017
    July 2017
    June 2017
    May 2017
    April 2017
    March 2017
    February 2017
    January 2017
    December 2016
    November 2016
    October 2016
    September 2016
    August 2016
    July 2016
    June 2016
    May 2016
    April 2016
    March 2016
    February 2016
    January 2016
    December 2015
    November 2015
    October 2015
    September 2015
    August 2015
    July 2015
    June 2015
    May 2015
    April 2015
    March 2015
    February 2015
    January 2015
    December 2014
    November 2014
    October 2014
    September 2014
    August 2014
    July 2014
    June 2014
    May 2014
    April 2014
    March 2014
    February 2014
    January 2014
    December 2013
    November 2013
    October 2013
    September 2013
    August 2013
    July 2013

    About

    This website was founded in July 2013.

    RSS Feed

    Categories

    All
    American Football
    Athletics
    Baseball
    Basketball
    Behavioural Economics
    Boxing
    Broadcasting
    Competitive Balance
    Cricket
    Cycling
    Darts
    David Butler
    Declan Jordan
    Drugs
    Ed Valentine
    Epl
    Esports
    Expenditure
    F1
    Fifa World Cup
    Finances
    Funding
    Gaa
    Gaelic Games
    Gambling
    Game Theory
    Gary Burns
    Geography
    Golf
    Greyhound Racing
    Guest Posts
    Horse Racing
    Impact Studies
    John Considine
    John Eakins
    League Of Ireland
    Location
    Media
    Mls
    Mma
    Olympics
    Participation
    Paul O'Sullivan
    Premier League
    Regulation
    Research
    Robbie Butler
    Rugby
    Simpsonomics
    Snooker
    Soccer
    Spatial Analysis
    Sporting Bodies
    Stephen Brosnan
    Swimming
    Taxation
    Teaching
    Technology
    Tennis
    Transfers
    Uefa
    Ufc
    World Cup
    Wwe

Powered by Create your own unique website with customizable templates.