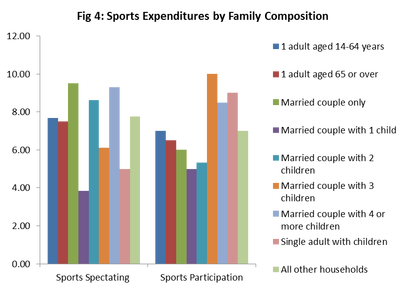
Figure 4 shows that sports participation purchases are on average higher for households with 3 or more children present and households with single adults and children and the ‘all other households’ category (which represents households with 3 or more adults and possibly children). In contrast the spending on sports spectating is quite variable across the different categories of family composition. As highlighted in my previous blog (here), it is probably the case that spectating cost are driven more by income than by the composition of the family.
Each of this week's posts uses the median level of expenditure for both sports spectating and sports participation and across selected qualitative variables. Caution should be exercised when making inferences as the numbers in some categories can be small, however some patterns of spending behaviour can be observed.
 RSS Feed