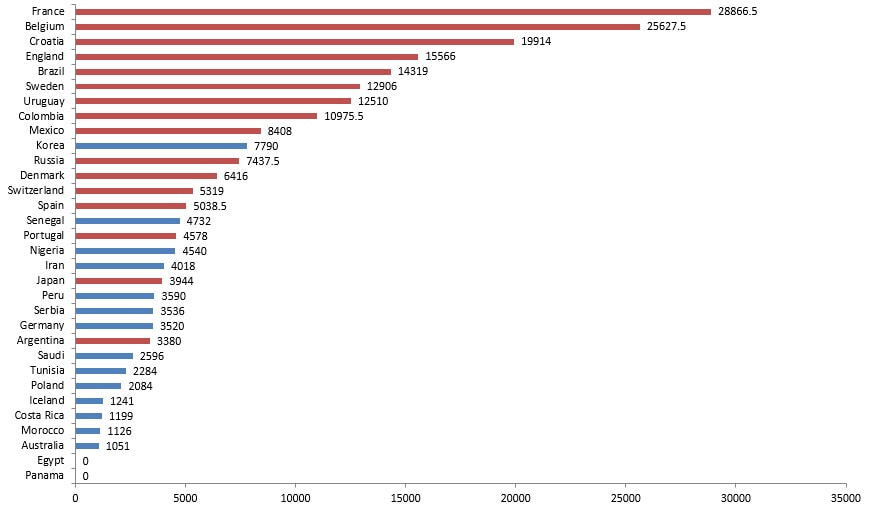
Designing a methodology to quantify performance can be open to debate. Individuals can have different preferences of what should be more important when measuring how a team has performed. For instance, in a cup competition, should a strong team progressing to a semi-final be seen as performing better than a weaker team progressing to a quarter final, but knocking an extremely strong team out on the way?
Even the official ranking methodology utilised by FIFA to quantify international team performance can be open to criticism, particularly when you read stories about how teams such as Wales were able to rise up the rankings by forgoing friendly games.
Nonetheless, this post attempts to quantify how teams in this summer’s World Cup performed utilising an experimental methodology. The methodology can be summarised as follows.
World Cup performance in a game is based on the following;
- 3 points are awarded for each win in the group stage and knockout stage.
- 1 point is given for a draw for both teams.
- 0.5 points is given if a team is knocked out in penalties in the group stage.
- Winning the 3rd and 4th place play-off is only worth 2.5 points
- Winning the final is worth 3.5 points
- 0 points are given for a loss in 90 minutes in the group or knockout stage.
- I control for goals scored and conceded.
- I control for the team and opponents strength by using the FIFA ranking points given out on the June 7th 2018.
Points for game i = (((Points in game after final whistle j + (Goals scored – Less Goals conceded)) * (FIFA Ranking of team j – (+/- Difference in FIFA Ranking of Opposition))
Prior to presenting the results here are some examples of calculating scores.
In the opening game of the tournament, Russia beat Egypt 5-0. For the latest FIFA rankings, Russia had 493 points, while Egypt had 465, therefore Russia where 28 points higher than Egypt. Russia’s points accumulated for this game would have been the following;(((3+ (5-0))*(493-28)) Russia would have gained 3,720 points for this game.
For the thrilling 3-3 between Spain and Portugal, Portugal would have accumulated 1,126 points, while Spain would have been given 1,274. The difference for this is that Portugal is considered a stronger side to Spain in the FIFA rankings. The Figure below plots team performance based on the methodology described above.
Like all methodologies’ the metrics generated here has flaws, namely it gives no credit to poor teams who may hold a very good team to a narrow defeat. Moreover, two strong teams drawing or one beating another is has more a less the same impact of two weak teams drawing or beating one another. Similarly, it would be worthwhile to control for a countries population, given how larger countries tend to outperform smaller ones, given the pool of talent they have to choose from. Future posts, may try to account for this, along with control for other factors.

 RSS Feed