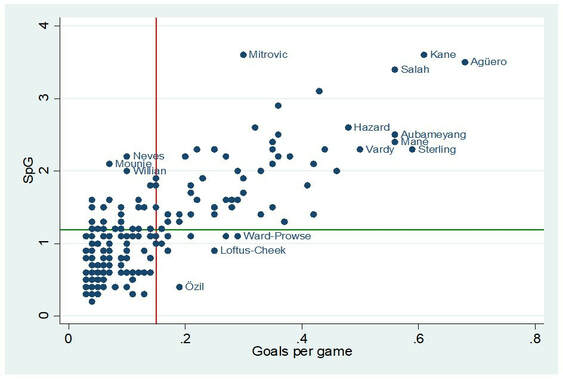
With some recent blog posts examining matters relating to the Premier League, this blog post will continue this theme, focusing on Premier League goal scorers and their efficiency in front goal. Data has the ability to provide illuminating insights into player performance and with that in mind I have collected information on all Premier League goal scorers (as of 19/04/2019). This post examines 202 separate Premier League goal scorers and plots the relationship between goals per game and shots per game.
The scatter plot below examines this relationship. On average these players score 0.15 goals per game (Red line) and have 1.2 shots per game (Green line). Therefore, individuals found to the right of the red line have on average, more goals per game then the average Premier League scorer. While those found above the green line on average have more shots per game then the average Premier League goal scorer.
To further examine shots efficiency we break our scatter plot into four quadrants. To summarise simply:
Top left quadrant as those players who “take more shots but score fewer goals”.
Bottom left quadrant as those players who “take less shots and score fewer goals”.
Top right quadrant as those players who “take more shots and score more goals”.
Bottom right quadrant as those players who “take less shots and score more goals”

 RSS Feed