By John Considine
A fair proportion of the pundits argue that Arsenal needed "to sign a No.9 who will score 20 plus goals a season". Others will reply with either "City won the title with a false-9 before the arrival of Haaland" or "Liverpool's Salah is not a No.9". The original contributors to the debate are likely to come back with "City needed Haaland to win the Champions League" and/or "Salah is scoring like a No.9". And the debate will run on.
In the debate, it would help if there was a clearer distinction between the number of goals and the distribution of goals. The picture below attempts to show both elements. The size of each ball represents the number of goals. The bigger balls are on the left of the picture. These are Liverpool, Manchester City, Arsenal and so on. The Hirschmann-Herfindal Index measures the concentration of goals amongst the goalscorers. The highest value is for Bournemouth where Dominic Solanke does most of the scoring. Arsenal have the least concentrated distribution of goals.
In the debate, it would help if there was a clearer distinction between the number of goals and the distribution of goals. The picture below attempts to show both elements. The size of each ball represents the number of goals. The bigger balls are on the left of the picture. These are Liverpool, Manchester City, Arsenal and so on. The Hirschmann-Herfindal Index measures the concentration of goals amongst the goalscorers. The highest value is for Bournemouth where Dominic Solanke does most of the scoring. Arsenal have the least concentrated distribution of goals.
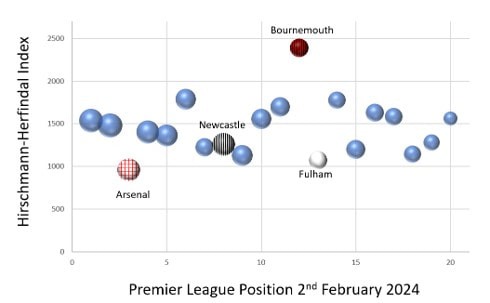
Arsenal have the same number of goals as Newcastle but a greater spread of the goals amongst its players.
Bournemouth are one place in the table, and one point, above Fulham. Fulham are second to Arsenal in terms of the distribution of scorers. On these numbers it is hard to make the case for Fulham needing a No.9. Yet, they were one of the main Deadline Day movers. They signed a traditional No.9 from Chelsea on loan. Maybe actions speak louder than words.
Bournemouth are one place in the table, and one point, above Fulham. Fulham are second to Arsenal in terms of the distribution of scorers. On these numbers it is hard to make the case for Fulham needing a No.9. Yet, they were one of the main Deadline Day movers. They signed a traditional No.9 from Chelsea on loan. Maybe actions speak louder than words.
 RSS Feed