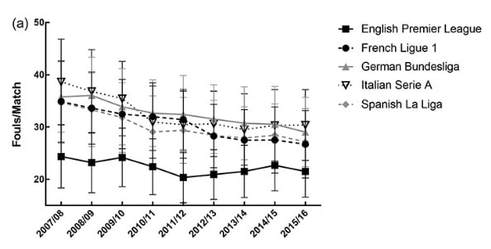
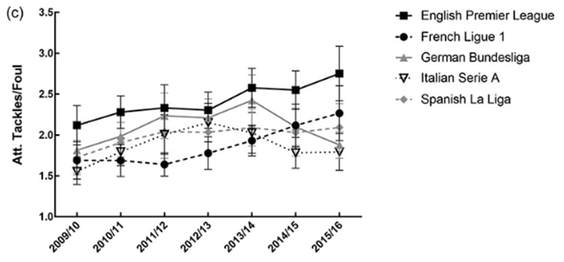
Figure 1 in the article has three parts. Part (a) shows the number of fouls per game for each season between 2007/8 and 2015/6. Part (b) shows the attempted tackles per game for the same seasons. Part (c) shows the attempted tackles per foul.
Figure 1(a) is presented below and shows that there are less fouls per game in the English Premier League. The number of fouls in the other four leagues show a clear decline. The number of fouls seems to be used to suggest that "European soccer has become less aggressive".


 RSS Feed