The Economics of Sport
  • Sports Economics
  • About
  • Workshop
  • Selected Publications
  • Book Reviews
  • A Primer on Gaelic Games
  • Upcoming Events
  • Media
  • Education
  • Resources & Links

The Lorenz Curve for Snooker

7/12/2015

 
By David Butler

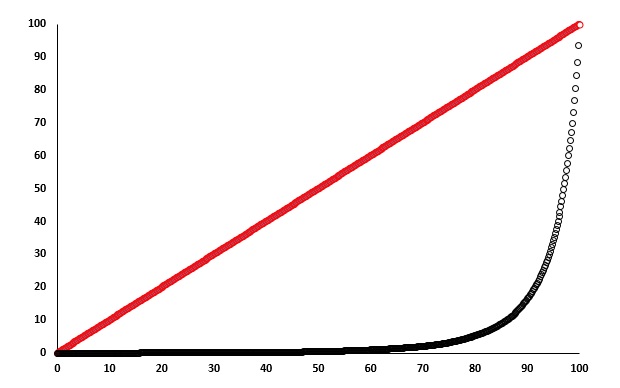
Last week I presented some data relating to prize money allocations in golf and horse racing. As a corollary, below is a Lorenz curve showing the distribution of prize money for 534 professional snooker players competing in 57 international tournaments over 23 years from 1992-2014.  

In Economics the Lorenz curve is a graphical illustration of an income distribution. This curve originated from the works of Economist Max Lorenz in 1905. The red line in the graph below is called the line of equality. The bowed line beneath is the Lorenz curve. The difference between both lines gives an indication of how unequal the distribution of winnings in snooker have been.  

The top 20% of snooker players over 23 years have claimed £65,339,628. That’s 95% of the entire earnings. England's Ronnie O Sullivan is the highest earner. He’s won 6.5% of the total prize money available. The Scots, John Higgins and Stephen Hendry are 2nd and 3rd while Wales’ Mark Williams is 4th in the list. The highest ranked Irishman is Ken Doherty in 13th position. There are only 3 players from outside the British Isles in the top 30 earners; Neil Robertson (Australia, 6th), Ding Junhui (China, 8th) and Marco Fu (Hong Kong, 17th).

For the more technically inclined, one can specify the degree of inequality in prize money by calculating what’s called a Gini coefficient. This is a measure of dispersion and is the ratio of the area between the red line (perfect equality) and the Lorenz curve, to the area between the black line and the line of perfect inequality.  The higher the Gini coefficient (0-1), the more unequal the distribution is. For international snooker the Gini coefficient is 0.88 indicating a high degree of inequality in prize money allocations in professional snooker.
Picture
The Lorenz Curve for Snooker: 1992-2014
The Pareto Distribution in Sport

30/11/2015

 
PictureThe Pareto Distribution
By David Butler

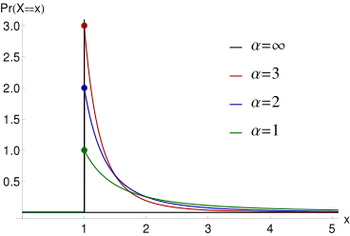
The Pareto distribution is quite famous in Economics and is named after the Italian polymath Vilfredo Pareto (1848-1923). Mathematically,  the distribution is referred to as a power law probability distribution (see graph) and it is applicable to phenomena in both the natural and social sciences.

The distribution has its origins in the income data Pareto  published in 1897 when he explored how wealth across society was allocated. Pareto found that the income distribution was not a bell shaped curve. There was many people at the bottom end of the wealth distribution, a wide middle class and some super wealthy individuals. His distribution is usually explained through the 80-20 rule of thumb.  80% of the wealth is usually owned by 20% of the people. This is usually a good approximation.

A fun and accessible way to  learn about the Pareto (and Pareto-like) distribution is through sports data.

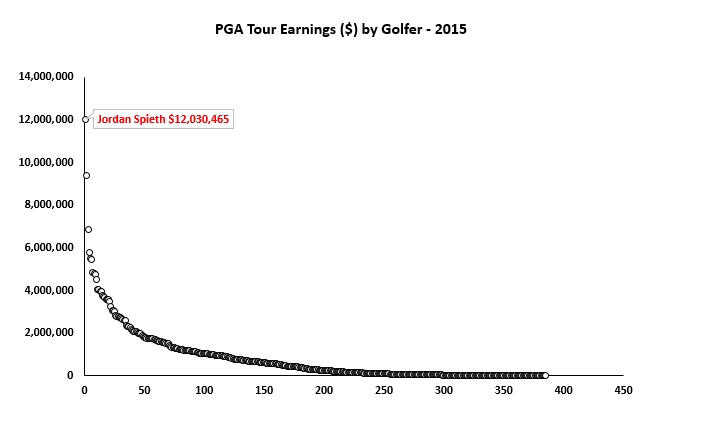
The graph below shows the PGA Tour Earnings for Golfers in 2015. Out of the 385 golfers on the tour Jordan Spieth has the highest earnings.  Like Spieth, there are a few very high earners but these are in the minority (e.g. Jason Day, Bubba Watson, Rickie Fowler, Dustin Johnson, Justin Rose and Rory McIlroy). There are some golfers earning a reasonable sum, the middle-class,  and then a glut of lower earners. The top 20% (77 Golfers) earned $218,010,501 together, that’s 68% of the total earnings. The remaining 80% (308) golfers divided the remaining $101,434,093 between them.

Picture
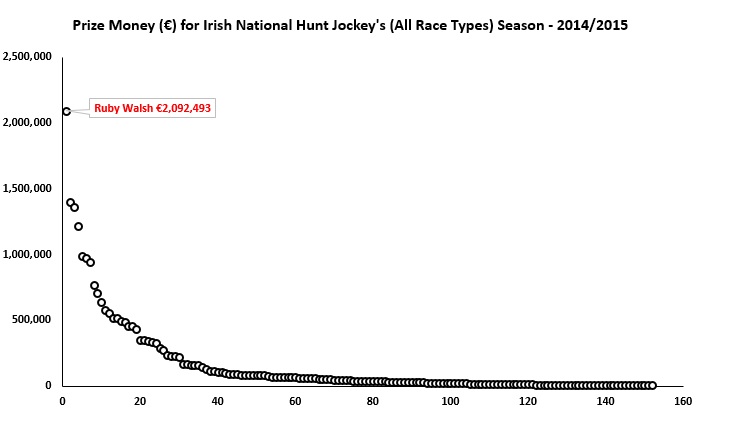
What about a different sport? The second graph shows the prize money earned by Irish National Hunt Jockey's (all race types) for the 2014-2015 season. While the earnings are far less than in golf, we still see a similar pattern. Ruby Walsh tops the list out of 152 jockeys. Bryan Cooper, Jonathon Burke,  Paul Townend and  Paul Carberry all perform very well too.  The top 20% (30) of the jockeys shared €18,785,125 between them. That’s 78% of the pie.  This left only €5,211,170 worth of earnings for the other 122 jockeys.
Picture
Of course, the more interesting question is why do such patterns emerge? The answer to this question has puzzled social scientists for years and is far too complex to address in detail here. To hazard a guess, these outcomes are not unicausal; no exclusive factor is probably causing the outcomes above. Albeit somewhat of a weasel word, the skewed distributions are often referred to as an ‘emergent property' of a system. Small, random differences at the start can amplify themselves and lead to significant differences down the road.

Ronald Koeman & Moral Hazard

23/11/2015

0 Comments

 
By David Butler

Last week the Southampton manager Ronald Koeman expressed his unhappiness with Martin O’Neill’s decision to use Shane Long in Ireland’s second leg play-off win against Bosnia.  Koeman was “very surprised he played 40 minutes. The player didn't train for five or six weeks, [and] had only one training session on the Sunday”.

Such instances are becoming increasingly common in modern football where a tension exists between parent clubs and home countries.  This outcome of the problem is often moral hazard. This is some form of after the fact opportunism; you take on an amount of risk while someone else pays the costs if things go wrong. For example, you may be more likely to drive your car dangerously or live an unhealthy lifestyle if you have car and life insurance respectively. 

While Ireland and Southampton have no formal contractual agreement, Southampton are paying the wages of Shane Long on a weekly basis and it is, of course, in their interest to have a fit performer for the entire Premier League season. Ireland however faced a crucial match where short term success was in their interest. Southampton gave advice to Martin O'Neill but ultimately Ronald Koeman had no decision making power – Ireland were deciding on how much risk to take on, Southampton were carrying the costs if things went badly!

Economists are often interested in designing contracts to ensure that efficient risk bearing occurs between two parties stuck in dilemmas like these. It will be interesting to see whether such mechanisms arrive in football in due course or whether a club will legally challenge an international association if their asset returns as damaged goods from international duty. Should clubs be compensated when an international manager decides to outsource the costs?

As a fan it was great to see Shane Long play for Ireland last week, as an economist I think some of the risk needs to be shifted to international associations.
0 Comments

Chelsea's Fall From Grace

18/11/2015

 
By David Butler

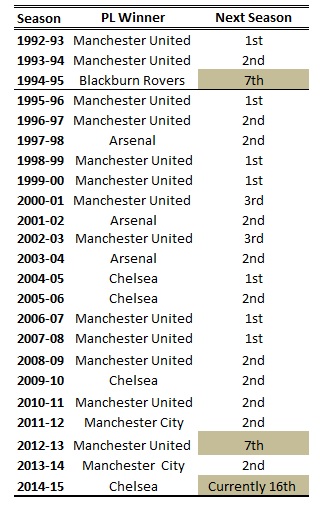
On the 29th of March 2013 I wrote about Manchester United's fall from grace under David Moyes. The article concerned how teams faired the season after winning the Premier League title. For the most part, teams that win the title offer a strong challenge the following season too, often retaining the trophy.

Given Chelsea’s current plight I thought it was pertinent to resurrect this idea. Only twice was a Premier League winner outside of the top three teams the season after winning the league; Blackburn Rovers were 7th in the 1995-96 season after topping the pile the year before and Man United’s infamous 2013-14 season under David Moyes saw them finish 7th.

Winning the league usually doesn't just have repercussions for the successful season only. GIven that the human capital on the field typically changes minimally, the champions often come back to win the league or are runners up the season after too.

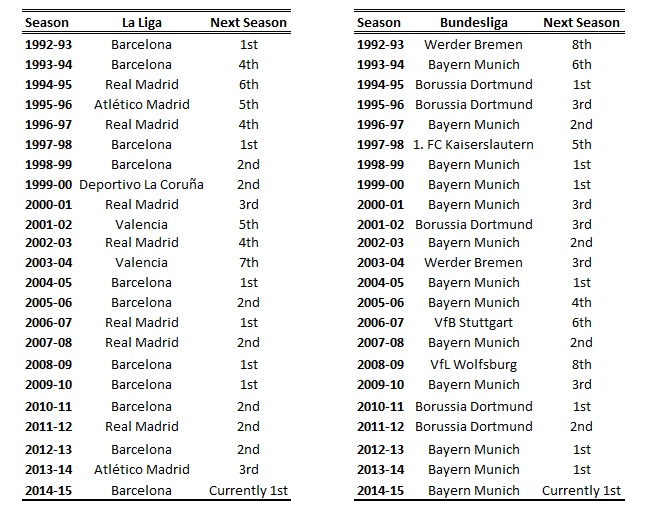
The table below looks at the same pattern for La Liga and the Bundesliga.
Picture
The lowest position a champion has finished the following season in La Liga was 7th (Valencia 2004-2005) while Werder Bremen (1993-1994) and Wolfsburg (2009-2010) both finished 8th the year after being crowned champions. While approximately 80% of champions in the EPL have returned to win the league or finish runner up the the next season, this rate is lower for La Liga (60%)  and Bundesliga champions (50%).

Something has definitely gone wrong for Mr. Mourinho. In my view Chelsea's fall is a product of many factors coming together: underperforming or burned-out stars, the sale of key personalities in the summer,  aging defenders, transfer failures (not securing the signing of John Stones), fielding young talent that may not  be quite ready, public relation disasters with staff and injuries to key players (such as Costa and Courtois) have all contributed to the 'crisis' .  While the stats would indicate that the champions may well bounce back from 16th, could Chelsea manage to finish worse than 7th?
Picture

How Many Senior Caps Will Jack Grealish Get?

9/11/2015

 
By David Butler

Over the last months I've reflected on the trade-off Jack Grealish has made by declaring to play international football for England. In short, I think he has weighed up the costs and benefits of a likely briefer, more lucrative career with England, that has the potential to offer more international success, against a longer but less financially beneficial career with Ireland. Sticking with the Boys in Green could have made him a cult hero, albeit for a nation which will likely be less successful in international competitions.

Although Grealish could not be called up to England's squad for the upcoming friendlies, (as he has to wait until the new year to be granted FIFA clearance) it struck me as interesting that Tottenham's Eric Dier, a player quite close to Grealish in age, made the squad for the first time. I asked myself , what age do English midfielders usually begin their senior international career?

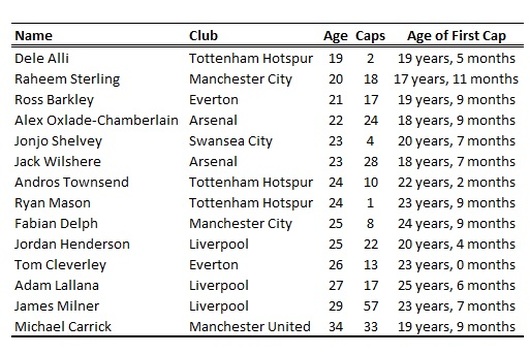
Below is a table that shows members of the current England squad and recent call-ups who were capped. They are ordered by their age (excluding Eric Dier who is yet to be capped at a senior level) . The table also shows the age of each player when they made their senior international debut for England.
Picture
Alli, Sterling, Barkley, Oxlade-Chamberlain, Wilshere and Carrick will all have been capped at a younger age than Grealish at a senior international level for England. Although it sounds bizarre, at twenty years and one month Jack Grealish  would not be considered 'young' if he is capped by Roy Hodgson. Raheem Sterling is the same age as him and has already chalked up twenty senior international caps. Ross Barkley is one year older and has twenty-one appearances. The Arsenal men Alex Oxlade-Chamberlain and Jack Wilshere, two and three years older respectively, have collected over fifty caps between them.

Some English players are capped at a later age and go on to achieve a high number of caps.  James Milner started at twenty-three and now has over fifty caps, and Jordan Henderson began his international career at approximately the same time Grealish might. The Liverpool midfielder currently has twenty-two caps. These instances are rarer however and, expectedly, players that begin their international career later in life generally collect fewer caps.

Jack Grealish will have to develop significantly to compete with the current crop of English talent. He will probably have to leave Aston Villa - a clear trend is apparent in the clubs the players above are contracted to.  A fair amount of Grealish's competitors are younger and have more senior international experience than him already. What's more, the table above just looks at midfield players, many forwards players such as Theo Walcott can play multiple roles (debuted at seventeen years and two months as England's youngest ever senior international). Neither does the table consider players outside of recent squads that could potentially be recalled (Ashley Young, debuted at twenty-two years  and four months) or  the next wave of English talent. It  probably won't be long before the next batch of young lions such as Jordan Ibe (Liverpool - nineteen years old), Ruben Loftus-Cheek (Chelsea - nineteen years old) and Josh Onomah (Tottenham - eighteen years old) catch Roy Hodgson's eye.
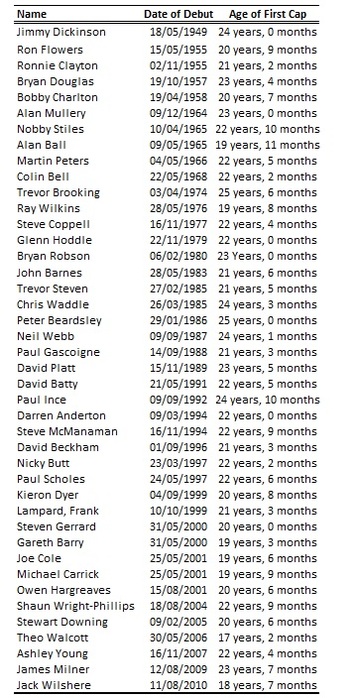
But what about English midfielders in general rather than the current crop of elites? The  second table shows a list of English midfield players who have reached twenty-five senior international appearances or more. The list is ordered by the date of their debut*. The time period is from 1949 to 2010 and some very famous names appear in the list. 

The average starting age for English midfielders who collect twenty-five caps or more in their career is twenty-one and a half. This statistic is favourable for Grealish. You may be thinking that the game has however evolved significantly since 1949. What may worry Jack more is that the average starting age of English midfield players has fallen over time; the average starting age of twenty-five plus cap midfielders since 2000 has been just twenty.

So to answer the question, how many caps will Jack Grealish get for England? My bet is that he is up against it to breach the twenty-five cap threshold. If he is going to get over twenty-five caps, he needs to begin his English career very soon, develop quickly, avoid serious injuries and be included in most squads. In sum, its later than he thinks.

My advice would be that Jack Grealish should look toward somebody like Jon Walters (thirty two years, thirty-seven caps) for inspiration on his international career choices. Maybe it's not too late. Of course,  that's just my opinion. Jack may well put more weight on one English cap than one hundred for Ireland. The value one puts on their nationality is, after all, private. Money may not come into the equation - just ask James McLean!

*One observation was omitted as there was ambiguity with the data for Billy Wedlock.
Picture

The EPL Media & Sponsorship - Economics Society Event

30/10/2015

 
By David Butler

On Wednesday 28th of October from 7pm-8pm in West Wing 5, University College Cork, Robbie Butler and myself gave a joint lecture for the UCC Economics Society entitled, 
The English Premier League; Media & Sponsorship.  The talk focussed on the football industry in England, how it is perceived by the media and how commercial aspects have evolved over the last 20 years. The talk was intended to be fun yet informative!

The slides from the lecture can be accessed below

David Butler

Robbie Butler

Declining Goals per Game

21/10/2015

 
By David Butler

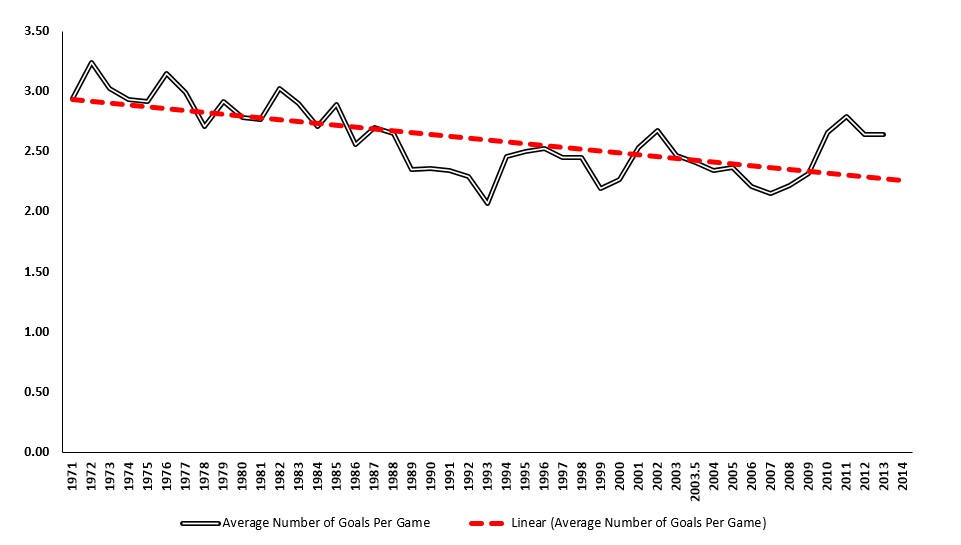
Recently, I asked whether the  League of Ireland was the most complex football league in the world. The graphic in that entry provided a preview of work I’m conducting with Dr.Robbie Butler that analyses the changing incentive structures in the League of Ireland – here’s another one.  The chart below shows the average number of goals per game in the league from the 1971 to 2014.
Picture
Average Goals Per Game in the LOI (1971-2014)
The average number of goals per game  is on a downward trajectory over these years. In the League of Ireland, as in other football leagues worldwide, goals are becoming scarcer.

Since the 1993 season (where the lowest average number of goals per game is observed), the average has slightly increased. This coincided with a change in the competition design; 3 points, instead of 2, were awarded for a win. You could interpret this rule change as an incentive for teams to increase attacking play and the switch to a 3 point system may have stemmed the decrease somewhat.
 
If readers are interested in the idea of goals being under threat, I would encourage them to check out Anderson and Sally’s excellent book The Numbers Game.

Economics & Pele's Boots

2/10/2015

 
By David Butler

Last week I came across an interesting story* that explained why Pelé tied his boots just before the start of a 1970 World Cup quarter final match against Peru. What seemed an innocent act by the Brazilian was actually a key juncture in the ‘sneaker wars’  that was on-going during the second half of the 20th century
between sports wear firms Puma and Adidas. The narrative provides another nice example of how concepts from game theory can be applied to the sports industry.

As the story goes, the two shoe manufacturers went through a period of intense rivalry in the 1960’s.  Both firms vied for a greater market share on the back of growing demand for sneakers, and endorsing athletes became an important advertising tool for the firms. Financially savvy athletes soon wised up to this rivalry and began demanding increasingly significant sums to wear their products. In response to these rising demands, Adidas and Puma began to cooperate with each other, attempting to scale down what had become an arms race for the top sports stars.  The most notable form of cooperation at the time was the Pelé Pact; both Adidas and Puma agreed that neither would endorse the world’s greatest footballer for the upcoming 1970 World Cup.

Was the cooperative Pele Pact  stable? Well, when Pelé asked the referee for those extra few seconds before kick-off to lace his boots (isn’t it amazing how he decided to tie them just then?), the camera zoomed in to show him wearing a shiny new pair of Puma's.

Apparently, Puma sent a company representative to the Brazil squad and after some negotiations Pelé accepted a lucrative deal to wear the Puma’s. Adidas were naturally furious that Puma breached the Pelé Pact and the fierce rivalry between the two firms recommenced. If Adidas had known that the pure conditions necessary for cooperation were absent they may not have acted so naïvely. The rational Puma scooped the prize!

My first thoughts when I heard this was that it was an urban legend but with a little research it seems the story checks out.  For those that want to explore the sneaker wars between Adidas and Puma further, see Barbara Smit's 2009  book  
Sneaker Wars: The Enemy Brothers Who Founded Adidas and Puma and the Family Feud That Forever Changed the Business of Sports.

*thanks to Sportseconomics.org contributor Gary Burns for introducing this story to me. 

Price & Performance at the Curragh Racecourse

23/9/2015

 
By David Butler

An interesting race took place at the Curragh racecourse in Ireland on Sunday the 13th of September. The Tattersalls Ireland Super Auction Sales stakes for 2 year old horses was the seventh race on the card. A condition of the race was that only yearlings bought under the hammer at the Tattersalls yearling sale in September 2014 could enter. From an initial 186 applicants, 30 horses were lucky enough to gain entry to the race.  These 30 horses competed for a share of the €250,000 prize pot. Each share depended on their finishing position. The most expensive horse in the race was Viren's Army, sold for €115,000 and the cheapest was Prove the Point who went for only €2,500.  

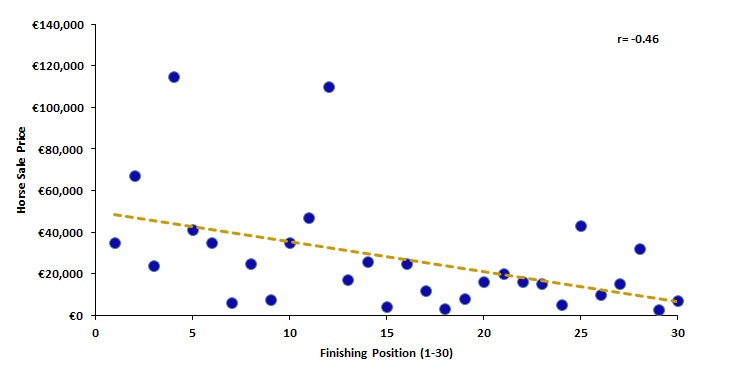
I watched on from the stands wondering whether the most expensive yearlings performed best?  The graph below plots the relationship between the price of each horse and their finishing position. The more expensive horses did tend to perform slightly better and a moderate relationship exists between price and performance. Glass House, at a cost of €35,000, finished first and scooped €123,000 for her Qatari owners. Not a bad return!

You can check out the full results of the race here.

Picture

75/25 - Penalty Success Rates in International Soccer

31/8/2015

 
By David Butler

The penalty shootout is a mechanism to decide tied matches in soccer. It was sanctioned by FIFA on the 27th of June 1970.
While the idea of a penalty kick was an invention of the Irish, the first major international competition decided through the shootout was the 1976 European Championship final between Czechoslovakia and West Germany. The inaugural penalty shootout in the World Cup finals occurred in 1982 between West Germany and France.

There are many factors associated with the success of individual penalty kicks that are specific to each player. These include psychology (player anxiety, stress and coping levels), ability (particularly shooting ability) and chance. Empirical analyses that consider shooting strategies for players have shown that penalties shot towards the upper left-hand side of the goal represent the most difficult shots to stop (Bar-Eli & Azar, 2009).

Below is data on 97 penalty shootouts (1033 penalty kicks) for six major international competitions from 1976 to 2015.In total for every three penalties scored, one is missed.  Penalty takers in the European Championships have had the most success (discounting the small sample from the Confederations Cup).

Substitutes are precisely no better or worse at scoring penalty kicks than players that start a match. What’s more, no evidence exists to support the argument that introducing a substitute in extra-time leads to improved performance in penalty shootouts. Fresh legs don’t matter too much when it comes to penalties and the performance of kickers is really independent of the time they spend on the field.

For more on this issue it would be wise to start with two papers by Jordet et al in (2007) and (2009).
Picture
<<Previous
Forward>>

    Archives

    September 2026
    August 2026
    July 2026
    June 2026
    May 2026
    April 2026
    March 2026
    February 2026
    January 2026
    December 2025
    November 2025
    October 2025
    September 2025
    August 2025
    July 2025
    June 2025
    May 2025
    April 2025
    March 2025
    February 2025
    January 2025
    December 2024
    November 2024
    October 2024
    September 2024
    August 2024
    July 2024
    June 2024
    May 2024
    April 2024
    March 2024
    February 2024
    January 2024
    December 2023
    November 2023
    October 2023
    September 2023
    August 2023
    July 2023
    June 2023
    May 2023
    April 2023
    March 2023
    February 2023
    January 2023
    December 2022
    November 2022
    October 2022
    September 2022
    August 2022
    July 2022
    June 2022
    May 2022
    April 2022
    March 2022
    February 2022
    January 2022
    December 2021
    November 2021
    October 2021
    September 2021
    August 2021
    July 2021
    June 2021
    May 2021
    April 2021
    March 2021
    February 2021
    January 2021
    December 2020
    November 2020
    October 2020
    September 2020
    August 2020
    July 2020
    June 2020
    May 2020
    April 2020
    March 2020
    February 2020
    January 2020
    December 2019
    November 2019
    October 2019
    September 2019
    August 2019
    June 2019
    May 2019
    April 2019
    March 2019
    February 2019
    January 2019
    December 2018
    November 2018
    October 2018
    September 2018
    August 2018
    July 2018
    June 2018
    May 2018
    April 2018
    March 2018
    February 2018
    January 2018
    December 2017
    November 2017
    October 2017
    September 2017
    August 2017
    July 2017
    June 2017
    May 2017
    April 2017
    March 2017
    February 2017
    January 2017
    December 2016
    November 2016
    October 2016
    September 2016
    August 2016
    July 2016
    June 2016
    May 2016
    April 2016
    March 2016
    February 2016
    January 2016
    December 2015
    November 2015
    October 2015
    September 2015
    August 2015
    July 2015
    June 2015
    May 2015
    April 2015
    March 2015
    February 2015
    January 2015
    December 2014
    November 2014
    October 2014
    September 2014
    August 2014
    July 2014
    June 2014
    May 2014
    April 2014
    March 2014
    February 2014
    January 2014
    December 2013
    November 2013
    October 2013
    September 2013
    August 2013
    July 2013

    About

    This website was founded in July 2013.

    RSS Feed

    Categories

    All
    American Football
    Athletics
    Baseball
    Basketball
    Behavioural Economics
    Boxing
    Broadcasting
    Competitive Balance
    Cricket
    Cycling
    Darts
    David Butler
    Declan Jordan
    Drugs
    Ed Valentine
    Epl
    Esports
    Expenditure
    F1
    Fifa World Cup
    Finances
    Funding
    Gaa
    Gaelic Games
    Gambling
    Game Theory
    Gary Burns
    Geography
    Golf
    Greyhound Racing
    Guest Posts
    Horse Racing
    Impact Studies
    John Considine
    John Eakins
    League Of Ireland
    Location
    Media
    Mls
    Mma
    Olympics
    Participation
    Paul O'Sullivan
    Premier League
    Regulation
    Research
    Robbie Butler
    Rugby
    Simpsonomics
    Snooker
    Soccer
    Spatial Analysis
    Sporting Bodies
    Stephen Brosnan
    Swimming
    Taxation
    Teaching
    Technology
    Tennis
    Transfers
    Uefa
    Ufc
    World Cup
    Wwe

Powered by Create your own unique website with customizable templates.