The Economics of Sport
  • Sports Economics
  • About
  • Workshop
  • Media
  • Selected Publications
  • Book Reviews
  • A Primer on Gaelic Games
  • Upcoming Events
  • Education
  • Resources & Links
  • Data

The Economic Impact of Qualification

16/10/2015

 
By Robbie Butler

​With qualification for Euro 2016 well within the grasp of the Irish team, some have begun to speculate what impact this might have on the Irish economy next summer. The general view is often that qualification for major tournaments has a positive impact on incomes in the qualifying country. The reality is somewhat different however, and is difficult to fully understand.

If the Boys in Green reach the Euro 2016 Finals in France next summer, the next nine months will feel quite different in this country. Once the finals approach people will start to consume their income in a particular way, which may be different to what they would have done if Ireland were not appearing at the competition.

One of the most obvious sectors to benefit from qualification is the hospitably sector. One need only witness what happened around Ireland last week, following victory over Germany, to see this. During the finals, the average fan will probably spend more on hospitality, than is normal for the summer months. Does this mean the economy is growing in size? Maybe not. Fans could simply be substituting from one product to another. If people socialise more during the finals next year, they are giving up something else. There is no net gain. There are of course winners and losers, but the economy is no bigger.

In fact, the Finals themselves are an Irish import. The fans that travel to France should we qualify, could spend between two and four weeks on French soil. Their incomes will be spent in France and therefore count as an import. The longer the Irish stay in the competition, the greater this figure will become. 

That said, one might find that qualification does get people to spend faster than they normally would in the domestic economy. It’s very difficult to pinpoint, but money may flow around the economy quicker, which would invariable cause the pie to grow. This could be driven by psychological factors including what we call animal spirits.

Undoubtedly there are positive externalities from qualifying. One is rising levels of happiness, which research has found exists long after an event is over. This again could impact positively on the velocity of money. Beware however. This is based on performance, and as we know from the summer of 2012, happiness evaporated quite fast following Ireland’s first match.

Researchers have also discovered other positive externalities. One of the more interesting is a reduction in crime. During important matches at the 2014 World Cup, crime rates in Montevideo, Uruguay, fell by 15 percent. It is likely similar effects would be found in other countries. This may not be true of the hosting country however. An investigation into crime rates in Barcelona on match days at the Camp Nou found that crime in the city as a whole actually increased, and was more prevalent closer to the stadium. The increased police presence on match days was obviously not enough to deter would-be criminals, whose chance of capture are significantly reduced with such large crowds. There are potential negative externalities, often associated with poorly performing teams, such as increased public disorder and domestic violence.
​
Whether or not the economy grows is therefore open to debate. What isn’t is the joy that the likes of Houghton, O’Leary, Keane and now Long, have brought to the nation. These events can’t be measured in economic output. They don’t have a monetary value. They are priceless. 
Sports Capital Grant Allocations

14/10/2015

 
By John Considine
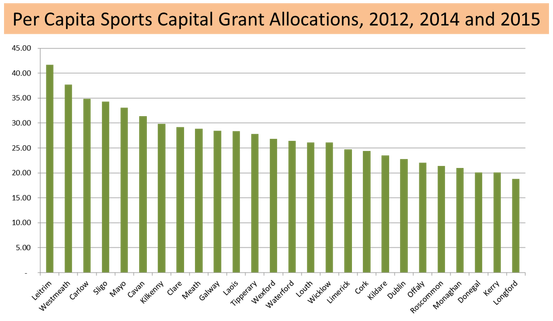
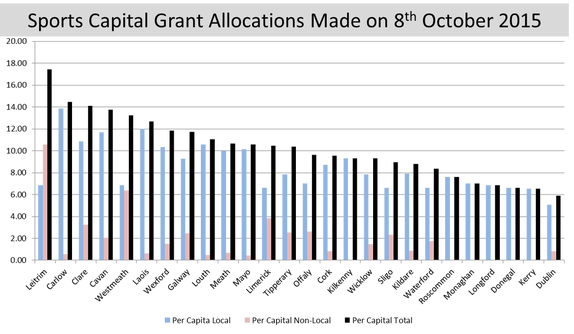
Last Thursday, before Ireland beat Germany, the Minister for Sport announced the 2015 sports capital grant allocations (here).  The allocations are presented by county.  There is also a distinction between Local Grants and Non-Local Grants.  A summary of the county allocations per person is presented in the picture below.  Leitrim received the highest per person allocation and Dublin the least.
Picture
The 2015 allocation were the third round announced by this minister.  Minister Ring claimed that the allocations have helped to facilitate participation by improving the sports infrastructure (here).  Combining the 2012, 2014 and 2015 allocations it is possible to also establish the per person allocation by county for the total amount distributed by the government.  Leitrim again heads the list of the 26 counties.

The Minister's county of Mayo is fifth on the list.  Previous Ministers who presided over three rounds of allocations found that their counties topped the list (i.e. Donegal and Kerry).  After his first round of allocations, Minister Ring said he was going to address the imbalance of the past.  He has done this to some extent.
Picture
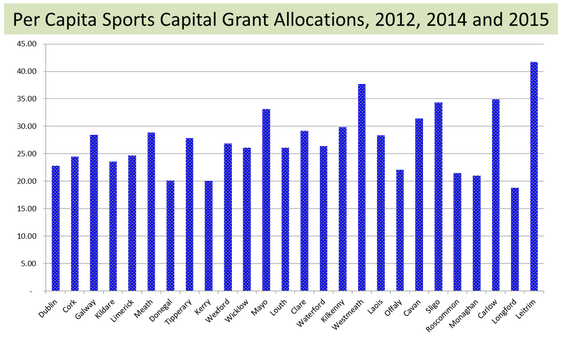
Leitrim tops the list of per person allocations.  It also has the smallest population of the 26 counties listed.  However, before we start thinking that smaller populations inflate the figure, it should be noted that Longford has the second smallest population and that county is at the other end of the distribution.  The picture below presents the allocations in order of county population.  Dublin has the largest population and Leitrim the smallest population.  This picture facilitates a comparison of a county's allocation with that of counties with similar populations.  For example, Westmeath did well when compared to Kilkenny and Laois.  Carlow also stands out in a comparison with Monaghan and Longford.  Offaly does poorly compared to Laois and Cavan.
Picture

Follow the Pundit!

12/10/2015

 
By David Butler

For the 2014/2015  season we recorded the predictions of Sky Sports pundit Paul Merson and BBC pundit Mark Lawrenson for English Premier League matches. For this season our Follow the Pundit! section provides weekly updates on the success of these football experts. 

After the gameweek 8, the stats for both pundits are below. Merson predicted just over half of the match outcomes correctly. Unfortunately Lawrenson gets more match outcomes wrong than right.
Picture
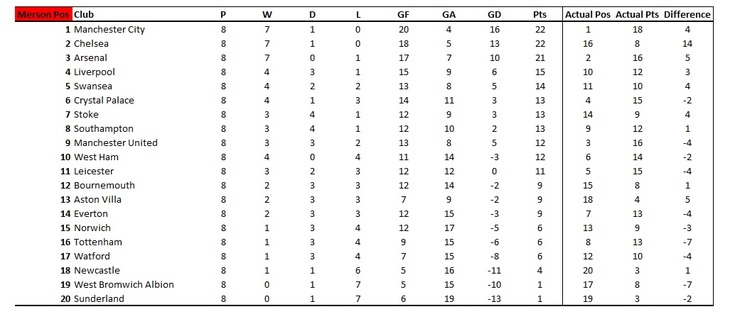
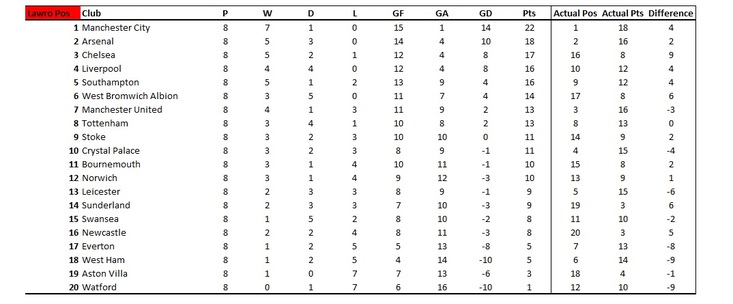
Below are Premier League tables that show the aggregation of Merse and Lawro's predictions. Already a common pattern is emerging,  similar to last season’s predictions - pundits underestimate the performance of teams toward the end of the table and overestimate the performance of those toward the top. 

Paul Merson - Gameweek 8

Picture

Mark Lawrenson - Gameweek 8

Picture
Some key points:
  • Both pundits have overestimated the performance of the clubs they would be primarily associated with as a player. Merse believed that Arsenal would be 5 points better off while Lawro thought that Liverpool would have 4 extra points at this stage.
  • Both pundits have underestimated the performance of their rival club. In the case of Merse he believed that Tottenham would be 16th. In reality they are 8th and have 7 more points than Merse suggested. Lawro believed that Everton would be 17th .In reality are 7th and have 8 points more than the ex-Liverpool man estimated.
  • Both pundits correctly call Man City to be leading the table but do overestimate their defensive performances. Lawro correctly calls the top two, suggesting that Arsenal would be 2nd.
  • Merse has correctly placed two of the bottom three teams (Newcastle and Sunderland), while Lawro has placed one right (Aston Villa)
  • Both pundits clearly overestimate Chelsea's performances.
 
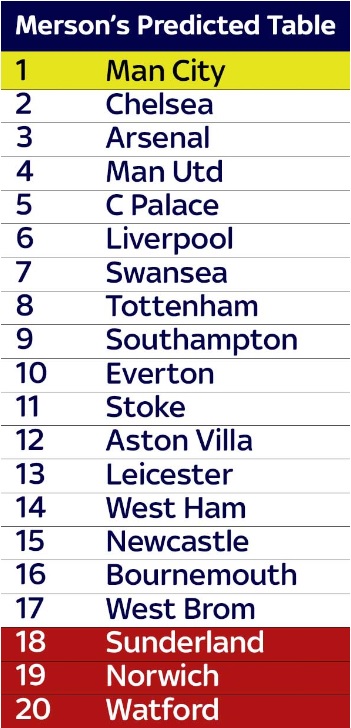
Interestingly, Paul Merson predicted the 20 clubs in the order he thinks they will finish at the end of the season in September. The question is, will his predictions be able to match his order? Currently he has matched the top 3 teams!
Picture
Source: Skysports.com 4/9/15

The Conroy Report, the League of Ireland and Sustainability

10/10/2015

0 Comments

 
by Declan Jordan
Picture
The League of Ireland is a remarkable entity. Supporters of its clubs criticise it harshly and frequently, but yet react strongly when criticism comes from others in the football community - especially the dreaded "barstoolers" who cheer at the screen as their (Premier league) teams' games are beamed via satellite. The league is the most competitive in Europe (8 different winners in 10 seasons) and at the same time reels from almost constant financial calamities (10 teams have gone out of business in the same 10 year period).

Almost as constant as the financial mishaps are the calls for reform of the league. This is despite the league going through significant changes every few years. The recent Conroy Report is the latest catalyst for soul-searching within the league. The report, prepared by Declan Conroy at the request of the Football Association of Ireland, is based on a wide consultation with clubs and stakeholders within the league. It makes for sober reading, despite the claims of strong brand recognition and a solid foundation for the league throughout. The report should be read by all who care about the sport in Ireland.

There is however a significant inconsistency that, in my view, undermines the key recommendations within the report. The most fundamental goes to the heart of the need for sustainability in the league. There can be no doubt that sustainability of the league (and member clubs) is the most important objective right now. This is why the proposed league structure would seem, at least to me, to work against clubs developing the medium to longer-term strategic plans necessary for their sustainability. Short-termism, rampant in football, is inconsistent with sustainability for an (at best) semi-professional league facing the circumstances of the League of Ireland.

The report recommends that the current two division structure should remain in place, with the exception that the two divisions should have 10 teams - rather than the current 12 team Premier and 8 team First Divisions. To facilitate this, in the 2016 division the bottom three clubs would be relegated (that is 25% of the clubs in the division) and the ninth placed club would play against the second placed team in the First Division in a relegation/promotion decider. That means potentially a third of the Premier Division teams could be relegated in one season. This creates a huge incentive for clubs to invest hugely (and potentially beyond their means) to maintain their status in the Premier Division in 2016. If they fail the consequences could be drastic, because of the huge gap in interest between the Premier and First Divisions. The report (on Page 16) provides data on attendances by Division for the last three full seasons. The table below shows this data, but includes a column dividing attendances by number of games to show average attendance per game.

Picture
Attendances per game in the First Division are less that a third of those in the Premier Division over the last three seasons. Clubs rightly see relegation to the First Division as a fate to be avoided at all costs.

As an aside, it's worth noting that if the current positions in the Premier Division were the same as at the end of the 2016 season (ignoring that one of these four will be replaced by Wexford Youths this year) the relegated clubs would be Limerick FC, Sligo Rovers, Galway United and Drogheda United - leaving no Premier Division team west of the Shannon and four of the clubs in the greater Dublin area. This also must be questionable from a sustainability perspective - though this is the nature of sporting competition.

The 10-team Premier Division in place from the 2017 season would also include a split between the top 6 and bottom 4, with the bottom club relegated and the tenth and eleventh teams playing in a round robin with second and third in the First Division. Two of those four clubs go up or stay up in the Premier Division. This means that each season 40% of Premier clubs are cut adrift from the top teams (with the prospect of losing revenue from games against top sides) and potentially 30% of clubs could be relegated. The top 6 clubs would be playing for the title and entry to the Europa League (with a play-off between teams positioned 3 to 5). On the other side, in the First Division, the 7 clubs not in the promotion round robin have little to play for in the latter parts of the season.

The motivation for this structure arises from the need to keep interest in league games through out the season. The report suggests attendance would be boosted by "more interesting games, more at stake, more 'occasions'" (page 17). There is a tension however between increasing the number of games with something at stake while at the same time encouraging clubs to develop a medium to longer-term strategic horizon - particularly where what is at stake is relegation to the nowhere land that is the First Division.

There are other approaches. On this blog I proposed an alternative MLS-style conference structure which increased the number of matches that had something at stake by introducing play-offs. This could be described as carrot approach rather than a stick approach. This would mean removing relegation - at least for a number of years - to provide clubs with certainty around the worst possible outcome each season. Each season would involve games against the top clubs but may not involve a play-off place. This means that clubs could plan appropriately, invest in structures including underage teams, player development, and grounds. In the current climate, League of Ireland clubs are not concerned about keeping themselves healthy - they are concerned with staying alive for the rest of each season. The only way to promote long-term sustainability is to provide clubs with some element of certainty and this means being more radical than the two-division structure suggested in the Conroy Report.
0 Comments

​Age, Recruitment and Domestic Performance

9/10/2015

 
By Ed Valentine,

We have previously explored age effects in football here. There is also a varied and detailed literature in academic circles. Recently, Lord Alan Sugar decided to wade into the debate and criticised the approach taken by Premier League clubs during BT Sport’s Fletch and Sav programme. He said that “the whole essence of the sport, the competitiveness, the training of young players has been taken away by going out and buying talent from Argentina or Italy”

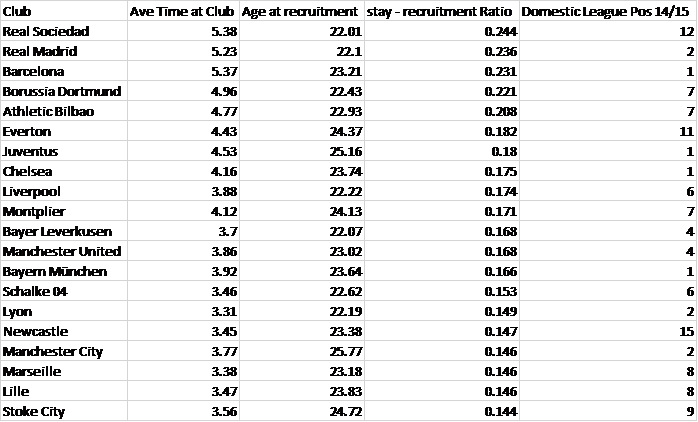
As can be seen from the table below, which is based on the top 5 European Leagues, the Premier League is not represented among the top 5 clubs when it comes to recruiting players in the run up to their prime. Everton, a club who have not made it to the group stages of the Champions League in the Premier League era are the highest ranked from the EPL.

The top three positions are occupied by Spanish clubs, one of which is Barcelona, who generally field about three “home grown” players in their starting 11. It seems like the biggest culprits in ‘removing the essence of the sport’ are not EPL clubs. (Average time at club is measured in years)
Picture
Data courtesy of Opta

Free-To-Air Subscription And The Champions League

7/10/2015

 
By Robbie Butler

A number of weeks ago I wrote about the history of TV Rights in the Premier League. Here's another piece that looks at something similar.

For the first time since the Champions League was launched in 1992 it is not available on free-to-air TV in Great Britain. This is due to the fact that in November 2013 subscription channel BT Sport won the exclusive right to screen live matches from 2015 to 2018.

Those familiar with the competition will know that free-to-air British broadcaster ITV hosted live coverage of the inaugural competition, and continued this exclusively up until 2003. That year, subscription channel Sky Sports came on board, and both channels shared the games. However, from 1992 until 2015, licence fee payers in the UK were guaranteed to see at least one match per round on free-to-air TV, even with the arrival of Sky Sports.

2015 sees a changing of the guard. The familiar voices of Clive Tyldesley, and more often than not Andy Townsend, who commentated on games for ITV, are gone from the air waves. What a pity for football-loving licence fee payers in Britain.

In Ireland we are more fortunate. TV viewers are insulated from broadcast competition somewhat. Rights for the Champions League continue to be shared by two free-to-air broadcasters; state owned RTE and independent TV3. The state broadcaster screens live action on Wednesdays, while TV3 show matches on Tuesdays. This means Irish licence fee payers get to see two matches per round over the course of the competition, a total of twenty-five live games on free-to-air TV. That's 25 more than people living in Great Britain. The licence fee in Ireland currently costs €160. So that’s €6.40 per match.

British customers aren't so lucky. BT Sport subscription is now required to watch the live Champions League games. The cost of this is a little complex and depends on whether you are a current BT Sport customer, BT Broadband subscriber, Sky TV customer or a new customer. For the purposes of this we’ll assume one is a new customer. The additional cost BT Sport is £5 or €6.78 per month for a new customer. That’s a total cost of just above €61. The additional cost allows one watch all 126 games in the competition in Great Britain. The current cost of a UK television licence is £145 (€197.61). That's a total cost of €258.63. Per match, this breaks down to about €2 per game.

However, given that one can’t watch more than one game at a time, the cost per game is above €10. That’s roughly an extra €4 per match to the British customer. Of course, this €4 does provide choice, but given that the free-to-air game in Ireland is often the “best game on paper”, is the choice required? I wonder would British customers prefer a return to the old system?
​
Long live free-to-air Champions League!   

* Thanks to Ed Valentine (based in Leeds) for an update on this. BT Sport Showcase will show a minimum of 12 games throughout the competition on free to air TV including the Final. Things a bit better than I thought...  

Are Side-Payments in Cycling Acceptable?

5/10/2015

 
By John Considine
Picture
Establishing the exact bounds for competition or cooperation in sport is never easy.  Examining how the rules are interpreted can be very interesting.  Dubner and Levitt used this approach in Freakonomics when they examined the behaviour of sumo wrestlers.  The authors contrasted the culture of honour with what seemed to be a willingness to allow a competitor to triumph in particular situations.  Allowing an opponent to win is usually deemed to be beyond what is acceptable.

The cycling world has its own formal and informal rules.  I've previously blogged about behaviour that is acceptable in cycling and not elsewhere and vice-versa.  Stage 9 and 10 of this year's Giro d'Italia brought some of these rules to the fore.  On stage 9 there was behaviour that could be considered predatory when a group of riders appeared to take advantage of difficulties encountered by a rival (here).  Then, on stage 10, Sky's Richie Porte was penalised 2 minutes for accepting help from a member of a rival team.  In this year's Vuelta a Espana, Vincenzo Nibali was disqualified after taking a tow from a team car.  Nibali was not impressed by the application of the rules (here).  Nibali expressed his displeasure at the behaviour of his opponents (and teammates) after he crashed.  If a grand tour winner, like Nibali, is unsure about the consistent application of the rules then it can be harder for the outsider to understand.

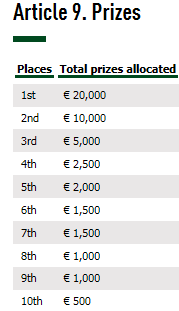
The lines are probably clearer when it comes to allowing an opponent triumph.  It is probably even clearer when money changes hands.  This was brought into focus last month with the announcement of an investigation into an alleged payment for reduced competitive effort in the 2010 Liege-Bastogne-Liege (here).  The allegation is that Alexander Vinokourov paid Alexandr Kolobnev a total of €100,000 to allow Vinokourov win.  A payment to allow him to win a race with a first prize of €20,000 (here)!  If the allegations are proved to be correct then who committed the bigger crime?  The one who made the payment or the one who accepted it?

Even if the allocations are proved to be correct then there may be a question about whether or not this sort of behaviour is acceptable.  The website CyclingTips clearly believes that this sort of behaviour is part of the culture and business of professional cycling (here).  If we are to believe what we read then it would be harder to condemn either cyclist for their behaviour.

Are teams more vulnerable just after they score? Not in the League of Ireland

3/10/2015

 
by Robert Reid*
Picture
You will often hear commentators claim that teams are more vulnerable to conceding a goal just after they have scored themselves. True or false?

Peter Ayton and Anna Braennberg tested the validity of this belief. They did so by considering matches across two seasons in the English Premier League that ended in 1-1 draws (this, they reasoned, shows that ‘each team was capable of scoring against the other’). There were 127 such instances during the 1994-95 and 1995-96 campaigns. I came across their study while reading Myths and Facts about Football: The Economics and Psychology of the World’s Greatest Sport (2008).

So, is the team that trails to the game’s opening goal more likely to score just after they have conceded themselves than at any other time during the match?

For each game, the time left after the first goal was divided into four quarters. Say, for instance, the opening goal was scored after 50 minutes. The remaining 40 minutes is divided into four 10-minute quarters. If teams are more likely to concede immediately after scoring, then, naturally, you would expect more equalising goals in the first quarter than the fourth. Is this the case?

It is not.

Based on their sample size of 127 games, Ayton and Braennberg found that equalising goals were more common in the fourth quarter (31pc) than the first (17pc) in the English Premier League – the opposite to what commentators would have you believe. I extended this idea to the League of Ireland (only Premier Division games were considered) to see how it compared to the English Premier League. Applying the same criteria, I also considered games that ended in 1-1 draws in the League of Ireland across the 2011, 2012, 2013 and 2014 seasons. Take the Sligo Rovers versus Dundalk fixture played in the League of Ireland’s Premier Division at the Showgrounds on Monday 18 August 2014 as an example. Sligo scored the opening goal of the match after 31 minutes. Dundalk equalised after 86. Dividing the time left after the first goal into four quarters results in 14.75 minutes per quarter (ie: 59/4). As Dundalk equalised 55 minutes later, we then divide 55 by 14.75 = 3.73. In other words, the equalising goal arrived in the fourth quarter.

Across the four campaigns in the League of Ireland, there were 91 instances of games that ended in 1-1 draws. Just like in the English Premier League, equalising goals are also more common in the League of Ireland in the fourth quarter (31 games from 91, or 34pc) than the first (13 from 91 games, or 14.3pc). This is the breakdown of goals scored in the four quarters over the four campaigns examined in the League of Ireland from 2011 through to 2014 (total of 91).

Q1: 13 (14.3pc)
Q2: 23 (25.3pc)
Q3: 24 (26.4pc)
Q4: 31 (34pc)

Beware the commentator’s cliché!

* Robert Reid, who trades the football and financial markets, recently successfully completed the Postgraduate Certificate in Statistics at Trinity College. Robert also obtained a Bachelor of Business Studies (BBS) degree at UCD as a mature student in 2007. A sports sub-editor at The Irish Sun, Robert is also qualified as a technical analyst. He has the MSTA designation from the Society of Technical Analysts (STA) in the UK.  Robert founded and manages the running of the Irish chapter of the STA. He is also a member of the Irish Soccer Writers’ Association and former secretary of the SWAI. He can be found on Twitter @robertreid64

Economics & Pele's Boots

2/10/2015

 
By David Butler

Last week I came across an interesting story* that explained why Pelé tied his boots just before the start of a 1970 World Cup quarter final match against Peru. What seemed an innocent act by the Brazilian was actually a key juncture in the ‘sneaker wars’  that was on-going during the second half of the 20th century
between sports wear firms Puma and Adidas. The narrative provides another nice example of how concepts from game theory can be applied to the sports industry.

As the story goes, the two shoe manufacturers went through a period of intense rivalry in the 1960’s.  Both firms vied for a greater market share on the back of growing demand for sneakers, and endorsing athletes became an important advertising tool for the firms. Financially savvy athletes soon wised up to this rivalry and began demanding increasingly significant sums to wear their products. In response to these rising demands, Adidas and Puma began to cooperate with each other, attempting to scale down what had become an arms race for the top sports stars.  The most notable form of cooperation at the time was the Pelé Pact; both Adidas and Puma agreed that neither would endorse the world’s greatest footballer for the upcoming 1970 World Cup.

Was the cooperative Pele Pact  stable? Well, when Pelé asked the referee for those extra few seconds before kick-off to lace his boots (isn’t it amazing how he decided to tie them just then?), the camera zoomed in to show him wearing a shiny new pair of Puma's.

Apparently, Puma sent a company representative to the Brazil squad and after some negotiations Pelé accepted a lucrative deal to wear the Puma’s. Adidas were naturally furious that Puma breached the Pelé Pact and the fierce rivalry between the two firms recommenced. If Adidas had known that the pure conditions necessary for cooperation were absent they may not have acted so naïvely. The rational Puma scooped the prize!

My first thoughts when I heard this was that it was an urban legend but with a little research it seems the story checks out.  For those that want to explore the sneaker wars between Adidas and Puma further, see Barbara Smit's 2009  book  
Sneaker Wars: The Enemy Brothers Who Founded Adidas and Puma and the Family Feud That Forever Changed the Business of Sports.

*thanks to Sportseconomics.org contributor Gary Burns for introducing this story to me. 

Forward>>

    Archives

    May 2022
    April 2022
    March 2022
    February 2022
    January 2022
    December 2021
    November 2021
    October 2021
    September 2021
    August 2021
    July 2021
    June 2021
    May 2021
    April 2021
    March 2021
    February 2021
    January 2021
    December 2020
    November 2020
    October 2020
    September 2020
    August 2020
    July 2020
    June 2020
    May 2020
    April 2020
    March 2020
    February 2020
    January 2020
    December 2019
    November 2019
    October 2019
    September 2019
    August 2019
    June 2019
    May 2019
    April 2019
    March 2019
    February 2019
    January 2019
    December 2018
    November 2018
    October 2018
    September 2018
    August 2018
    July 2018
    June 2018
    May 2018
    April 2018
    March 2018
    February 2018
    January 2018
    December 2017
    November 2017
    October 2017
    September 2017
    August 2017
    July 2017
    June 2017
    May 2017
    April 2017
    March 2017
    February 2017
    January 2017
    December 2016
    November 2016
    October 2016
    September 2016
    August 2016
    July 2016
    June 2016
    May 2016
    April 2016
    March 2016
    February 2016
    January 2016
    December 2015
    November 2015
    October 2015
    September 2015
    August 2015
    July 2015
    June 2015
    May 2015
    April 2015
    March 2015
    February 2015
    January 2015
    December 2014
    November 2014
    October 2014
    September 2014
    August 2014
    July 2014
    June 2014
    May 2014
    April 2014
    March 2014
    February 2014
    January 2014
    December 2013
    November 2013
    October 2013
    September 2013
    August 2013
    July 2013

    About

    This website was founded in July 2013.

    RSS Feed

    Categories

    All
    American Football
    Athletics
    Baseball
    Basketball
    Behavioural Economics
    Boxing
    Broadcasting
    Competitive Balance
    Cricket
    Cycling
    Darts
    David Butler
    Declan Jordan
    Drugs
    Ed Valentine
    Epl
    Expenditure
    F1
    Fifa World Cup
    Finances
    Funding
    Gaa
    Gaelic Games
    Gambling
    Game Theory
    Gary Burns
    Geography
    Golf
    Greyhound Racing
    Guest Posts
    Horse Racing
    Impact Studies
    John Considine
    John Eakins
    League Of Ireland
    Location
    Media
    Mls
    Mma
    Olympics
    Participation
    Paul O'Sullivan
    Premier League
    Regulation
    Research
    Robbie Butler
    Rugby
    Simpsonomics
    Snooker
    Soccer
    Spatial Analysis
    Sporting Bodies
    Stephen Brosnan
    Swimming
    Taxation
    Teaching
    Technology
    Tennis
    Transfers
    Uefa
    Ufc
    World Cup
    Wwe

Related

The website is not formally affiliated to any institution and all of the entries represent the personal views and opinions of an individual contributor. The website operates on a not-for-profit basis. For this reason we decline all advertisement opportunities. 

Contact

To contact us email sportseconomics2013@gmail.com or find us on Twitter @SportEcon.