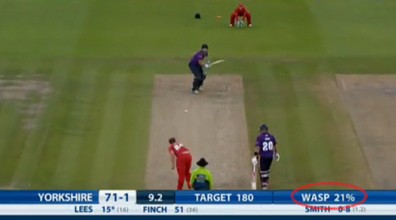
Those of you who are fans of cricket and particularly the ODI (One Day International) and Twenty 20 limited overs versions may have noticed a new feature introduced by Sky Sports in their cricket coverage. Known as WASP or the Winning and Score Predictor, this statistical tool acts as a very simple way of tracking the outcome of the match. In essence it has two features, firstly predicting the total score of the team batting first and secondly predicting the chances of winning for the team batting second. The latter is given in terms of a percentage, so for example if the WASP equals 20%, then the team batting second has a 20% chance of winning at that point in the match.
I’m sure many of you are probably saying “so what?”, but Cricket is a game where, because of the way the scoring works, assessing who is winning at a point in the match can be very subjective. What is particularly interesting about the WASP (and what can add to the intrigue of the match) is that its value is recalculated ball by ball. So if a team batting second hits a six, the WASP percentage will increase whereas if the team loses a wicket, the WASP percentage will decrease. And as is often the case with run chases in cricket, a team’s chances of winning can fluctuate throughout the innings and potentially go from the very low to the very high (and vice versa) within a few balls.
The other interesting feature about WASP is that it was developed by two economists at the University of Canterbury, Dr. Scott Brooker and Dr. Seamus Hogan. Brooker carried out the research as part of his PhD studies under the supervision of Dr. Hogan. A working paper on the subject can be found here. A less technical description of the underlying methodology and a set of frequently asked questions about WASP can be found here and here on a set of blog posts by Seamus Hogan. In these posts he makes the point that WASP is not a predictor of who is likely to win the game but rather a predictor of who is winning at a particular point during the match. He gives an example of a match involving Australia and Ireland. If Ireland bat second and get off to a great start, posting a lot of runs in the first couple of overs and not losing any wickets, the WASP score is likely to show them to be winning at that time. Most cricket observers (and bookmakers!) would still however have Australia as their favourites given their past performance.
And this is essentially how WASP works. It takes data from past cricket matches and predicts who is winning if the two teams are playing on an average basis, that is, playing based on the average performance of a top-eight batting team against a top-eight bowling/fielding team. It doesn’t take into account the relative strengths or current form of the teams and players. So it’s not perfect but it does make for interesting viewing especially in tracking the progress of the WASP as the game progresses and in the final few overs of a close game when WASP values can change dramatically.
 RSS Feed