Robbie Butler posted on this blog a couple of times about the importance of adjusting for inflation when comparing transfer fees in deciding which are the largest transfers. Equally it's important to have a mechanism for comparing transfer fees across time. For example, how do we compare the transfer of Di Maria in 2014 to, for example, the then record transfer of another Manchester United Number 7, Bryan Robson from West Bromwich Albion in 1981 for £1.5m?
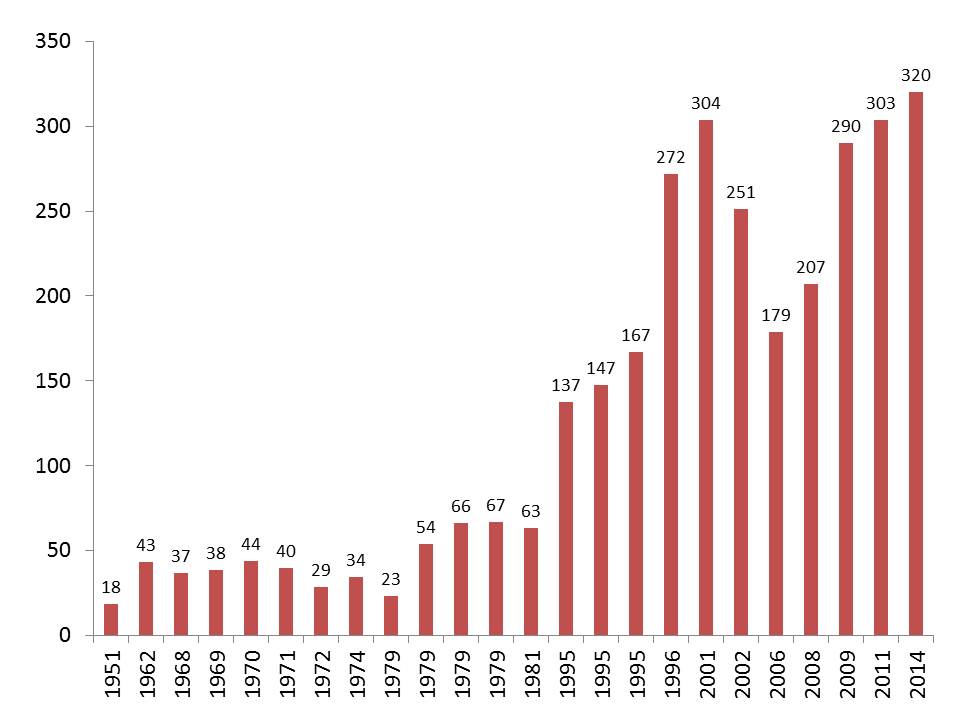
One approach would be to compare the purchasing power of the transfer fees in terms of another product. The graph below shows the number of average price houses that could be purchased with each record transfer fee paid by an English club. The data on transfer fees is sourced from Wikipedia (health warning attached) and the data on house prices is sourced from the Nationwide House Price Index (a little less of a health warning). The house price is the mean price for all housing units taken for the last quarter of the relevant year. This may be an appropriate benchmark as both are capital rather than current expenditure. Of course, housing will be a longer term investment than a striker.
So, in 1951, Jackie Sewell went from Notts County to Sheffield Wednesday for £34,500. That was the equivalent of 18 average priced houses. Angel Di Maria's fee is the equivalent of 320 houses. It's clear that football transfer fees have risen significantly in a relative context over the last 60 years. What is interesting, I think, from the graph is the decline in relative transfers fees through the 2000s - since these are all record transfers it must be driven by a booking UK property market. The Di Maria transfer is not significantly higher in relative terms than the transfer of Sebastian Veron from Laxio to Manchester United in 2001 for £28.1m. I really hope this latest transfer of an Argentinian to United works out a lot better than the last one.
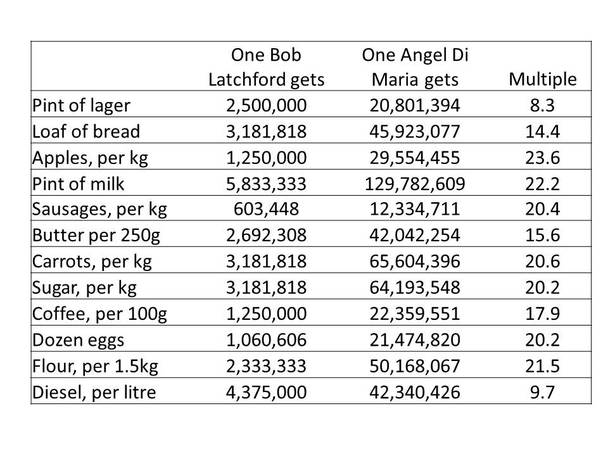
What's noticeable in the table is the differences in the rate of increase for some products. While Di Maria is equivalent to 22 times more milk than Latchford, he would 'only' but 8.3 times more lager and 9.7 times more diesel. This indicates the choice of reference point can provide somewhat different stories.


 RSS Feed