The Economics of Sport
  • Sports Economics
  • About
  • Workshop
  • Selected Publications
  • Book Reviews
  • A Primer on Gaelic Games
  • Upcoming Events
  • Media
  • Education
  • Resources & Links

The Finances of Football Associations in Britain and Ireland

17/4/2014

 
by Sean O'Connor
Picture
Information on and interest in football clubs’ finances have grown considerably over the years, to the point whole financial reports have been published on them. One of the most well known and anticipated is the “Deloitte Football Money League”. This yearly report, now in its 17th edition provides a detailed analysis of clubs’ financial performance over the course of a season.

However, while financial information on clubs is generally easy to access, information on national associations’ performance generally goes undocumented, at least in a comparable sense.  Fortunately a large level of information on national associations’ financial performance is readily available and with this in mind I’m going to examine a number of financial measures for the football associations of England, Wales, Scotland, Northern Ireland and the Republic of Ireland from 2003-2012

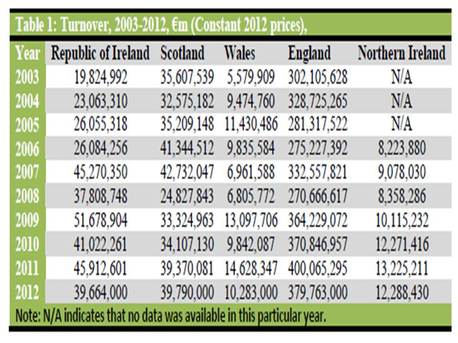
Turnover or revenue highlights monies received by each association from ticket sales, sponsorship deals, television rights, qualification for tournaments etc.  Although all associations are generating a greater level of turnover in 2012 than that recorded in 2003 (or 2006 for Northern Ireland), none can match the capabilities of England. This is no surprise when you factor in the revenue streams that the FA has to call upon in comparison with the other associations. Qualification for major championships, multi-million pound sponsorship deals with Budweiser, Vauxhall as well as the TV rights to the FA Cup mean England are a juggernaut with regards to revenue generation. Surprising is Ireland’s impressive performance on turnover throughout the period. A doubling of revenue in the FAI from 2003 to 2012 is a significant achievement given the interim period didn’t see the nation qualify for a major tournament (they did qualify for the European Championships in  2012), which usually brings with it increased sponsorship revenue.
Picture
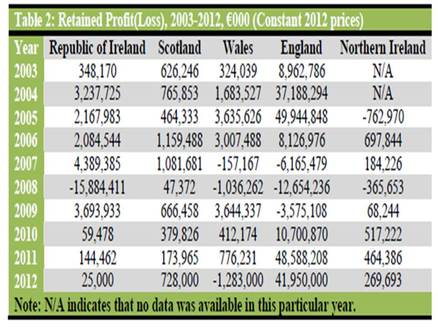
Retained Profit refers to the profit left to an association once all costs and taxes have been accounted for. During the period examined the FAI was the association making the largest loss (in 2008). A number of factors were noted for this loss, operating losses being the greatest of them. (Click here for summary). FAI profits have dropped dramatically from highs of over €4m in 2007. Of all the associations the Welsh FA was the only organisation to record a loss for 2012. Throughout the entire period the SFA recorded profits in every year with 2006 being the most impressive. 
Picture
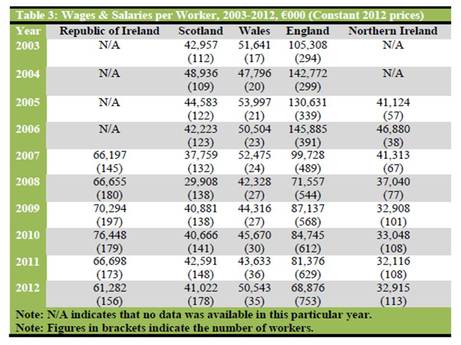
Examining wages and salaries from a per worker basis, no association is paying staff on average more than what they did at the start of the period under review. If we take the change in wages since 2007, as this year provides comparable data for all 5 associations, FAI salaries per worker fell by -7.5%, Welsh FA by -3.7% England FA by -30.9% and IFA by -20.3%. During this period only the SFA per worker salaries increased, by 8.6%. Only the FAI has decreased staff numbers, with all other associations employing more staff now than they did in 2008. 
Picture
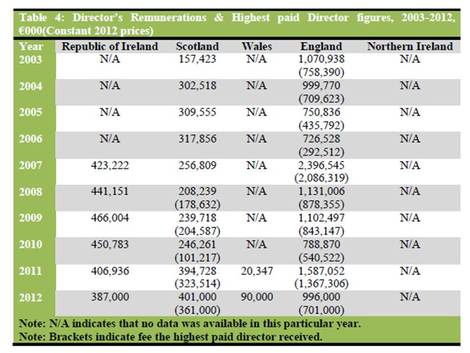
Table 4 highlights the fees which directors of the various associations received throughout the period examined. In the FAI, in nominal terms John Delaney was paid a salary of circa €431,000 in 2010, however adjusting for inflation this corresponds to circa €450,000 in 2012 terms. Only the highest paid director in the FA received a higher allowance, of circa €701,000, which is nearly double what the highest paid director of the SFA receives. However, it should be noted that the fee to the highest paid director in the FA has dropped considerably since 2011 (-48%). In contrast the SFA has increased the amount paid to its highest paid director since 2010. Directors’ fees in the other associations are quite substantial in comparison to the Welsh FA. In 2012 €90,000 was paid out in directors remunerations, up from circa €20,000 the previous year. 
Picture
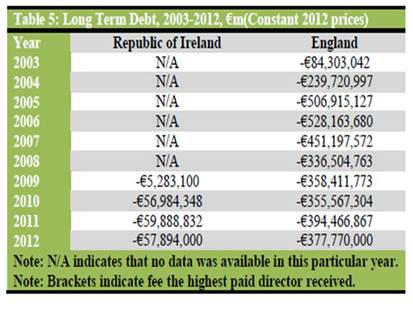
Throughout the period examined both the FAI and English FA undertook considerable costly capital projects. In the FAI’s case this was the reconstruction of the Old Lansdowne Road and new Wembley for the FA. As Table 5 indicates these projects added considerably to both associations long term debt, which has been a focal point of many opinion pieces in regards to both associations. In fact the FAI have acknowledged that they may not be able to achieve their ambition to be debt free by 2020, and having only reduced their long term debt by 3.3% between 2012 and 2011 it is easy to see why. Similarly the FA are extremely determined to reduce their debt burden, so much so that they’ve sold the naming rights to their stadium for both football matches and music concerts. 
Picture

Capital cities and football success in former communist countries

14/4/2014

0 Comments

 
by Declan Jordan
Picture
Recently reading Jonathan Wilson's Behind the Curtain: Travels in Eastern European Football I was struck by the pattern of success among clubs from capital cities in the former Soviet and Eastern European countries. It reminded me of a section in Simon Kuper and Stefan Szymanski's Why England Lose and Other Curious Football Phenomena Explained (I prefer that title to the Soccernomics one for perhaps obvious reasons). In Chapter 7 they explain why clubs from provincial cities in Europe tend to dominate European competition. The book was published in 2009 and they made the point then that in the first 41 years of the European Cup (1956 to 1997) there was no winner from a capital city in a democratic country. Real Madrid won it in 1998, 2000 and 2002 when Spain was democratic and since the book was published Chelsea won in 2012. That's four victories in 57 years of European Cup history.

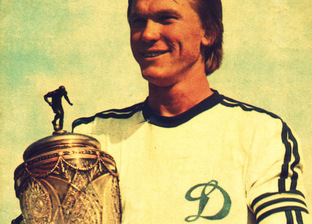
Kuper and Szymanski argue that clubs in capital cities are not as successful as those in provincial cities because football matters less in capitals - because of the availability of other "distractions". It seems as well that history matters. Real Madrid managed to break the pattern of failure of capital city clubs because they had built their stadium, support and brand during the years of Franco's dictatorship. They note that totalitarian regimes tend to send resources (including football talent) to capital cities because that is where they and the bureaucrats live. There is a quote in Wilson's book on Ukrainian football before independence from the Soviet Union that Dinamo KIev were so dominant in Ukraine because the political regime allowed them to hoover up all of the best talent so that they could "represent" Ukraine in the Soviet league. He says

For half a century Dynamo [Kiev] reigned supreme in Ukrainian football, and everybody else still lives in their shadow.

"In the Soviet period, Dynamo were almost sure of beating every other Ukrainian team", Jozsef Szabo, a former Dynamo player who was appointed coach for a second time...explained. "It was like a pyramid in Ukraine with Dynamo at the top". Crucially, the patron of the club through the seventies and eighties was Volodymyr Scherbytskyi, the leader of the Ukrainian Communist Party. "He was a great football fan", Szabo said, "and if there was a good player at Dnipro or Shakhtar or some other Ukrainian club he would make one phone call and the player would be in Kyiv - no money, or anything like that".

It would be difficult to overestimate the extent to which Dynamo dominate the psychological landscape of Ukrainian football.
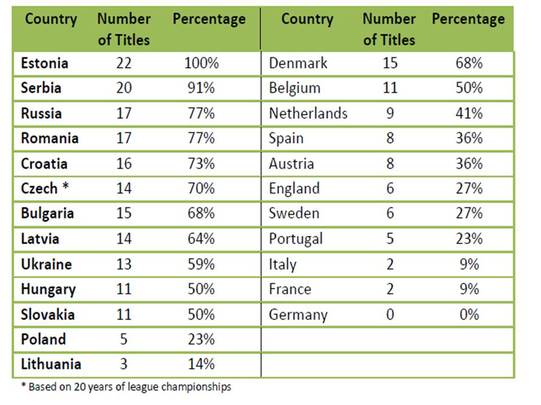
The table below shows the extent to which clubs from capital cities in former Communist states in central and eastern Europe have won the title since the establishment of independent leagues following the collapse of Communist rule. Most of these leagues began in 1992, so the table refers to 22 seasons to 2013. For comparison it also shows the success of clubs from capital cities in Western European countries for the same period (the nine Dutch titles refer to Ajax - who of course are based in Amsterdam which is the de facto capital of the Netherlands if not the administrative capital - if I use ADO Den Haag the numbers falls to zero). 
Picture
There appears to be a strong bias in the former communist countries in favour of clubs from the capital cities. This bias is much stronger than it is in western countries. Poland and Lithuania stand out as exceptions where every other country has at least half of the championships being won by capital clubs. In the western states, only Denmark and Belgium have rates of 50% or more. Eight of the thirteen former communist states have rates above two thirds, with Estonia notably not having any winner of their championship from outside of Talinn.  

It certainly does seem that there is a path dependency in these countries. Jonathan Wilson's book is not very positive on the organisation and quality of the leagues in these countries so we shouldn't expect to see these countries copying Real Madrid and producing a Champions League winner any time soon. 
0 Comments

Venue Choice & WrestleMania

12/4/2014

 
By Robbie Butler

Something a little lighter for a Saturday. Last week subscription televsion GAA coverage finally became a reality in Ireland. The public backlash has been as expected. Many fans of Gaelic Games are upset that they may now have to pay to watch live coverage of Championship games previously available on free-to-air TV. Paul O’Sullivan discusses the issue at length here.

However, spare a thought for fans of World Wrestling Entertainment (WWE). With the exception of a limited number of hours per week on Sky One, all WWE action broadcast in Ireland and the United Kingdom is only available through subscription channel Sky Sports. Those of us from a particular vintage will remember the likes of Hulk Hogan, Bret ‘Hitman’ Hart and the recently deceased Ultimate Warrior parading under the previous banner WWF. These legends have been replaced by new stars on Monday Night Raw and Smackdown, weekly staples for fans of sports entertainment.

On a monthly basis, a ‘main event’ takes place. These events are not available on subscription television but are hosted on a pay-per-view platform. On Sunday last, WrestleMania XXX was hosted in the Mercedes-Benz Superdome, New Orleans, Louisiana. Irish fans had to pay the princely sum of €21.95 for live television coverage of the event.

Very few events are broadcast through this medium but demand must exist in this country if the pay-per-view route is used. It’s curious that such an approach is taken for what can only be described as a minority ‘sport’.

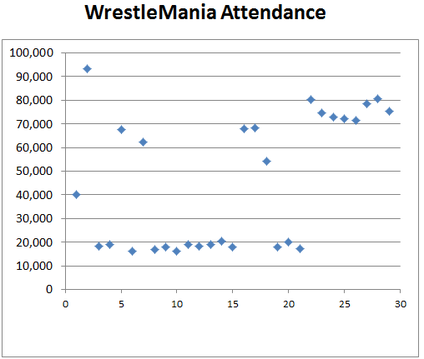
This leads to another curious question. WrestleMania is the highlight of the WWE calendar. First hosted in 1984 the event has grown in size and stature. WrestleMania 29 had a greater attendance than the 2013 Super Bowl and is estimated to have generated more than $100 million for the New Jersey economy.

The hosting venue has followed a quite unusual pattern. Peak attendance occurred in 1987 at WrestleMania III when 93,173 people packed into the Silverdome in Pontiac, Michigan. Four years later just over 16,000 fans attended the sold-out event at the Los Angeles Memorial Sports Arena. WrestleMania 2000 had just 18,034 spectators at the event, yet the following year nearly 70,000 fans gathered for WrestleMania X-Seven in Houston, Texas.

Picture
UEFA would never host the Champions League final in a 20,000 seater stadium. The Super Bowl has never been played in front of less than 60,000 spectators. In the post war era, the Summer Olympics has always been hosted at a stadium with a capacity of 57,000+ spectators. Why the large fluctuations in hosting venues?

Interestingly, since 2007 WrestleMania has been held at a stadium with capacity for 70,000+ fans. Furthermore, each of the seven states selected to host the event from 2007 to 2013 (with the exception of swing state Michigan) traditionally vote Republican in US Presidential elections. In fact, there has been a movement away from typical Democratic states towards more Republican ones over the life of WrestleMania. Following nearly a decade of 70,000+ attendees it’s hard to understand why the event would ever return to a 20,000 capacity venue, as happened from 2004 to 2006.

California is due to host WrestleMania 31. The Democratic state hosted the event in 1991, 1996, 2000 and 2005 with a peak attendance of just 20,193 in 2005. The combined attendance over the four events was 73,238, less than turned up to WrestleMania XXX last Sunday night. However, the 68,000+ Levi’s Stadium in Santa Clara, CA will host next year’s event and give many more fans of the Golden State a chance to watch their favourite stars in sports entertainment.


What determines child participation in sports in Ireland

10/4/2014

0 Comments

 
by Declan Jordan
Picture
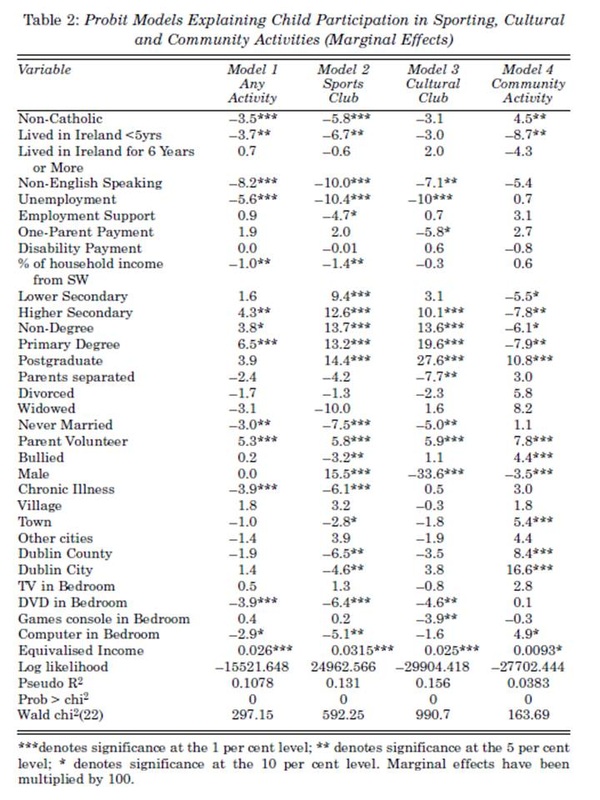
The most recent edition of the Economic and Social Review (Spring 2014) contains a very interesting paper by Bryan Coughlan, Edel Doherty, Ciaran O'Neill and Brian McGuire on the relationships between minority status and social welfare status and child participation in sporting, cultural and community activities. The data comes from the Growing Up in Ireland (GUI) survey and it finds that children from minority ethnic households and from households in receipt of social welfare payments participate less in structured activities, such as sports and cultural activities. The results of their estimation is shown below in full. Here it may be interesting though to focus on the second column which shows the determinants of participation in sporting activities. The GUI states that a child participates in sport where they are a member of a sport or fitness club, such as a gym, a GAA club, a soccer club etc. This means the survey doesn't capture all sporting activities such as those through school but this is a good measure none the less of structured activity.

Some of the findings include that children of non-Catholics are less likely to participate in sport though more likely to participate in community activities. Children born outside Ireland and that have lived in Ireland for less than 6 years are less likely to play sports, as are children of unemployed parents and where English is not the primary language spoken in the household. Children of mothers with higher education levels are more likely to play sports relative to children whose mothers have completed primary education. Boys are more likely to play sports, and less likely to participate in cultural and community activities.

There are differences in the types of structured activities in which children participate whether they live in towns or villages or in Dublin or other cities. Relative to children living in the open countryside, those in towns, in County Dublin and in Dublin City are less likely to play sport (and more likely to participate in community activities). This is a little surprising for me as I would have expected the availability of sports clubs is greater in towns and in the capital. Perhaps the availability of alternatives is driving lower sports participation as the study finds higher participation in towns and in Dublin in community activities, relative to those living in the open countryside. In a previous post John Eakins, using the Household Budget Survey, showed that urban households spent more on sports participation than rural ones. There may be classification issues around urban and rural though this suggests that urban households spend more but participate less. Perhaps it shows up a weakness in the GUI question on sports participation in that it shows only whether a child was a member of a club but not how many clubs or how much activity was undertaken. In urban areas children may have greater choice and so may play more sports (with more cost).

Children in wealthier households are found to be more likely to participate in sports (and the other structured activities). This is similar to another post by John Eakins on spending by household social status. 

Picture
0 Comments

Does Managerial Change Work?

8/4/2014

 
By Robbie Butler

This week has seen two more managerial causalities in the Premier League. According to reports in the media, Tim Sherwood will be relieved of his duties as Tottenham manager in May. This comes hot on the heels of Chris Hughton’s sacking by Norwich. The Irish man’s dismissal means that amazingly there are now no black managers in the entire Football League!

Hughton’s replacement Neil Adams will become the 29th man to manage in this season’s Premier League. Many have questioned the wisdom of the move. I previously addressed this issue
here. 

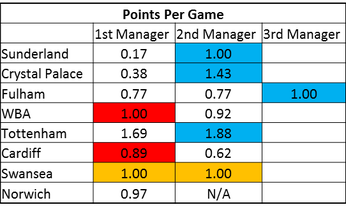
Norwich have become the eighth club to change manager this season. Only one of these changes has really worked (Crystal Palace). Sunderland are far better under Gus Poyet but remain bottom. Fulham have seen some improvement but only after their second managerial change, while Tottenham’s progress under Sherwood will probably still not be enough for him to keep his job. Two managerial changes have really backfired. West Brom and Cardiff both accumulated more points per game under their former managers.


Picture
The league position of the sacked manager and the current manager is slightly different. Gus Poyet’s Sunderland, despite improving dramatically remain bottom. Tony Pulis’s Crystal Palace have moved from 19th to 14th. Cardiff however have fallen from 16th to 19th since Malkay MacKay was dismissed. Norwich fan’s better hope Neil Adam’s is more of a Tony Pulis than an Ole Gunnar Solskjær.

Public Funding, Political Targets, and Public Priorities

7/4/2014

0 Comments

 
By John Considine
At the end of March, Sport England announced a cut to the funding of football.  The cut was based on the failure of the FA to increase participation.  The Guardian quoted the Chief Executive of Sport England, Jennie Price, as saying that the FA and the profesional clubs needed to work together to increase participation (here).  Owen Gibson's story explains how Sport England proposes to use the €1.6m cut from grassroots funding to fund a "football city" pilot for which cities can bid.  I was left thinking of the line attributed to Yogi Berra - "its deja vu all over again".

Another journalist from The Guardian, David Conn, has written on this subject before.  In his book Richer Than God he weaves together the many strands that go to make up the private and public funding of football.  Conn explain how the professional clubs suck in greater and great amounts of revenue while the facilities for local football are starved of cash.  Read his chapter on 'The Beautiful Game' for a grim account of the reality.  Elsewhere in the book Conn talks about how the public funding of the game has changed.  His explains how public funding has been rechannelled to special projects for which local authorities bid.  Ironically, it was Manchester's success in winning the Commonwealth Games that allowed them to build a stadium that was then handed over to Manchester City.  Private interests benefiting from special projects made possible from public funding.

In his recent piece Owen Gibson talks about football paying the price for delivering the promises of increased participation attached to the 2012 London Olympics.  That London 2012 failed to inspire a generation seems to be accepted.  Gibson himself wrote about it last December (here).  However, this was predictable.  In late 2011, Lord Moynihan, the chairman of the British Olympic Association, forecast that London 2012 would not increase participation because politicians failed to provide funding and a lack of links between schools, local sports clubs and volunteers (here).

Again, it is worth reading the account provided by David Conn in his book.  Conn talks about the lack of facilities at local level and contrasts this with what was spent on London 2012.  A Football Foundation commissioned survey estimated it would cost £2bn (later revised to £7bn) to bring the facilities up to a decent standard.  Conn also documents how prior to bidding for the Olympics, Tony Blair's strategy unit produced a document called 'Game Plan'.  Conn quotes a sentence from the review of the evidence and the conclusion reached in the document: "It would seem that hosting events is not an effective, value for money method of achieving a sustained increase in mass participation".  Yet, money that could have been spent to upgrade facilities was spent on the Olympics.  So, why should football (or any other sport) carry the can for over optimistic political promises and political failure to deliver the relevant resources?

Only last week Moody's brought us another reminder of the lure of bidding for international sporting events for questionable return (here).  Moody's estimate that the benefits to the Brazilian economy, from the FIFA World Cup, will be relatively small and temporary.  They also highlight the downside risks.  The demonstrations that surrounded last year's Confederations Cup in Brazil suggest that not all of the citizens agree with this type of public expenditure.

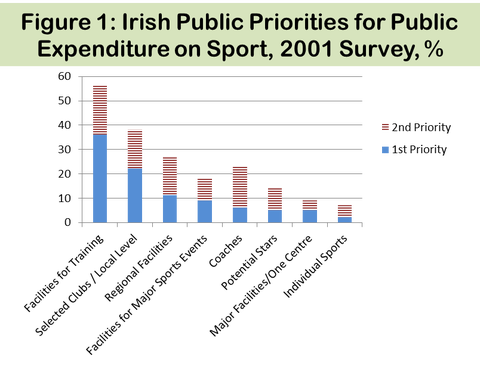
So what priorities have the public when it comes to public expenditure on sport?  Maybe they should be asked.  Thirteen years ago the Irish government commissioned a survey of public opinion on the issue.  Around that time the government was considering building a national stadium as a centre-piece of a sports campus in Abbotstown.  The government broadcast the results of one survey question.  That question asked if the public was in favour of the government plans for the stadium.  It was a Yes/No type of question.  Around 70% of the respondents were in favour of the stadium.  However, when the public was given a choice of how to allocate the funding the results were different.  One part of the survey asked the respondents to list their 1st and 2nd preferences for funding.  The results are presented in Figure 1 below.  'Facilities for Major Sports Events' and 'Major Facilities in One Centre' did not seem to be high on the Irish public list of priorities for the allocation of public funds.

For a variety of reasons the stadium at Abbotstown was never built.  Instead, Lansdowne Road was renovated.  In the years that followed, the government provided large amounts of funding for facilities at local level.  While the geographical allocation of some of the funds might display a political bias, there is little doubt that many of the facilities around the country improved.  The Irish policymakers deserve credit for shelving plans for a third major stadium in Dublin (regardless of the exact reasons for the decision).  They also deserve credit for increasing the funding for other facilities.  It is only fair that if we blame them for the rain then we give them credit for the sunshine.
Picture
0 Comments

Attending Games or Watching on TV

5/4/2014

0 Comments

 
By John Considine
This week there has been plenty of column inches in the print media, and large amounts of airtime on broadcast media, devoted to one aspect of the next round of broadcast rights to GAA games - the Sky element.  This blog has also posted on the issue (here and here).  One aspect of the coverage has focused on the exclusion of viewers who do not have access to the relevant Sky Sports package.  This debate is usually framed in terms of a comparison between TV viewing figures on Pay-TV versus free-to-air.  UCD historian Paul Rouse, and his work, have featured heavily in the discussion on the issue (see previous post on Paul's work here and a NewsTalk Off-the-Ball interview with Paul at 19mins in Part 2 of the programme of April 3rd here).  Therefore, for a small novelty value, I would like to look at the large numbers of people that are excluded when a game is not available on TV.

A comparison of the number of TV viewers and those who attended last September's All-Ireland finals is a useful place to start.  Table 1 below shows that for the All-Ireland football final between Dublin and Mayo there was 12.65 people who watched the game on RTE TV for each member of the public inside Croke Park on the day.  The ratio for the drawn and replayed hurling games are 10.84 and 7.56 respectively.  The lower figure for the replay is influenced by it being broadcast on a Saturday evening.
Picture
An advantage of looking at the figures for the All-Ireland is that the attendance figures are fairly steady at around 82,000.  The variation in the ratio comes from the TV audience.  Most of the spectators at an All-Ireland final will be from one of the competing counties (this is particularly so for a replay and may help account for the larger attendance).  While the TV audience is more widely spread, it is probable that having Dublin in the final contributed to the viewership figures as its population is 1,273,069.  The combined county population for the football finalists is 1,403,707 while that for the hurling finalists of Cork and Clare is 636,228.

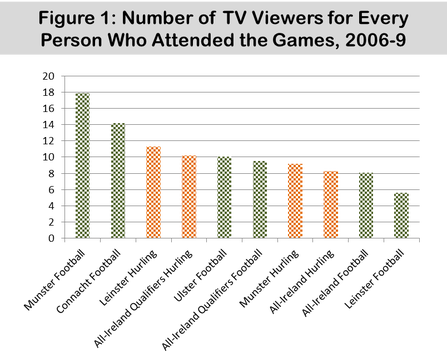
A feature of All-Ireland finals is that, as designated sporting events, they have to be broadcast on free-to-air TV according to the Irish application of the Television Without Frontiers directive.  Therefore, there is not a decision about whether or not to put these events on TV.  However, when games that are not designated events are not on TV then there is a loss of viewers.  We can approximate the ratio of TV viewers to those attending by repeating the above analysis for other games.  It is an approximation because it is difficult to say how many did not attend the games because they could watch it TV.  I did this a number of years ago for about 160 games during the 2006-9 seasons.  The ratios of viewers to attendees is presented in Figure 1.
Picture
For all games the ratio of TV viewers to spectators was 8.83.  The ratio for all hurling was 9.37 whereas that for all football games was 8.51.  Figure 1 further decomposes these figures.  The large ratio for Munster football ratio is probably exaggerated because it has only three games included.

At present the GAA games tend to be scheduled and broadcast on Saturday evenings and Sunday afternoons.  The above numbers are for games on such "slots".  Where one of these slots are left without a free-to-air TV game then the GAA is missing out on promoting inter-county games.  However, even here the analysis is approximate, as it could be argued that a day free of inter-county games on TV provides a chance for people to go to a club game.
0 Comments

International Carding Scheme: Athletics Top 10

4/4/2014

 
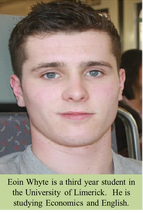
By Eoin Whyte, University of Limerick
Picture
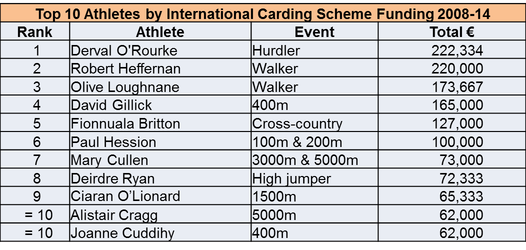
The International Carding Scheme is undergoing massive changes in its criteria for the distribution of funding for Irish Athletes and the year 2013-14 was described as a” transition phase” by the Irish Sports Council. This followed the earlier revamp in 2010. The year 2010 was a watershed year for Irish athletics with massive investment taking place for the  development athletes. Eighty-five athletes in total receiving funding in 2010, this can be compared to the mere 19 athletes who received funding the following year through the carding scheme. The number of athletes receiving funding was on the increase from 2008-2010, with 73 athletes funded in 2008, 81 in 2009 and 85 in 2010. By 2014, only 12 athletes were funded directly through this scheme.
 
Between 2008 and 2014 the Irish Sports Council gave out €2.6m in funding to athletics through the International Carding Scheme. This €2.6m was divided amongst 129 athletes: 64 female and 65 male.

The table below lists how much went to the top 11 athletes for the 2008-14 period. While 129 Irish athletes received funding under the scheme, a total of€1.34m has gone to these eleven athletes during the seven years. This is over fifty per cent of the total funding provided under the International Carding Scheme for Irish athletics during the period discussed. Only three athletes in the top eleven received consistent funding throughout 2008-14: O'Rourke, Heffernan and Britton. Sprint hurdler, Derval O'Rourke was the most highly funded athlete. Notably only one ‘field’ athlete, Deirdre Ryan, is in the top 10. The high jumper received no funding in the years 2010 and 2014.

Walkers comprise two of top three most  funded athletes in Irish athletics with Ireland enjoying unprecedented success in the sport in recent years, most notably Robert Heffernan's 50k world championship gold in August 2013 and Olive Loughnane's silver in the 2009 World Championships.

Picture

Buying Success?

3/4/2014

0 Comments

 
By Robbie Butler

Manchester City are now odds-on to win the 2013-2014 Premier League title. Rewind fifteen years. City are battling to make the Second Division playoffs (League 1 today). Neighbours Manchester United are on course for their famous treble, the highlight of Sir Alex Ferguson’s reign. 
 
How times change.

Football purists often belittle City’s recent achievements and some accuse them of “buying the title”. This may be so, but did United not do this in the 1990s and 2000s? Were Liverpool not guilty of the same crime in the 70s and 80s? 

Even if you buy into this theory, United fans should be concerned about their own spending patterns. While transfer data is notoriously inaccurate, a best guess estimates that moneybags City had a ‘cheaper’ team on show at Old Trafford recently. The home side's starting eleven cost £185.6 to assemble, while City’s cost £178.05. This estimation even uses nominal data. Inflation adjusted estimations would push United even higher and probably put Rio Ferdinard close to £50 million mark! 
Picture
So are Manchester City buying the title or are they just buying better than everyone else?     
0 Comments

The Growth of Third Level Sports Courses

2/4/2014

0 Comments

 
By John Considine
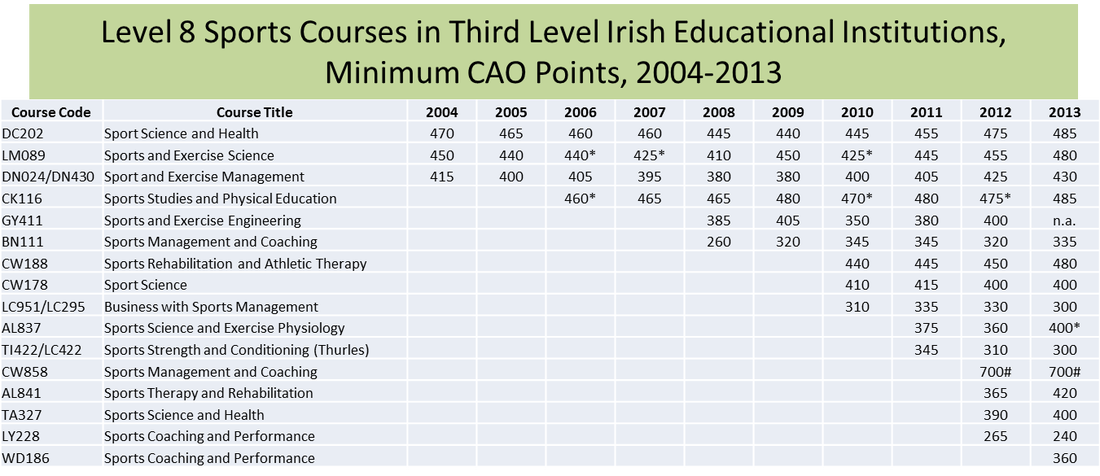
An examination of the Central Applications Office (CAO) documentation on entry points for sports courses shows there has been a large increase in the number of courses offered over the last decade.  The table below lists the courses and the minimum CAO points required for entry.  These are Level 8 courses or undergraduate degrees.  The list is based on a search for the word “sport” (DN272 Horticulture, Landscape and Sportsturf Management was not included).  The * signifies that not all applicants at this point level were offered the course and the # signifies an interview may be required.
Picture
Over half of the courses listed have appeared since 2010.  And, all of these new courses are being delivered by the Institutes of Technology (ITs).  IT Carlow, Athlone IT and Limerick IT offer seven of the 10 "new" courses.  IT Carlow offers CW178, CW188 and CW858.  Athlone IT offers AL837 and AL841.  Limerick IT offers LC295 and LC422.  The remaining three courses are offered by IT Tallaght (TA327), Letterkenny IT (LY228) and Waterford IT (WD186).

The courses that have been longer in existence tend to have the words “science” and “exercise” in the titles.  The newer courses are more likely to have the words “coaching”, “management” and “performance”.  The word "Business" appears in only one title.

Not only is there an increase in the number of courses on offer since 2010 but the points required for entry to the traditional courses have also been increasing since 2010.  The only courses listed for the full 10 year period 2004-13 are Sports Science and Health (Dublin City University),  Sports and Exercise Science (University of Limerick), and Sports and Exercise Management (University College Dublin).  The CAO points increases for these three courses since 2010 have been +40, +55, +30, respectively.

It is more difficult to map the changes in CAO points into the economic environment.  The points for the three longer established courses tended to decline from 2004 to 2008/9 before starting to increase thereafter.  Gross National Product (GNP) adjusted for inflation increased from €122bn in 2003 to€148bn in 2007 before declining for two year to €132bn in 2009.  It then increased slowly to €133bn in 2012.

It is possible that the sports area is one of the areas that students expect an increased demand for their talents and qualifications over the coming years.  It is also possible that individuals are taking these course as part of their lifelong learning journey.  Or it could be a version of supply creating its own demand.  Regardless, consumers have a wider range of alternatives and this is usually a good thing.
0 Comments
<<Previous
Forward>>

    Archives

    May 2026
    April 2026
    March 2026
    February 2026
    January 2026
    December 2025
    November 2025
    October 2025
    September 2025
    August 2025
    July 2025
    June 2025
    May 2025
    April 2025
    March 2025
    February 2025
    January 2025
    December 2024
    November 2024
    October 2024
    September 2024
    August 2024
    July 2024
    June 2024
    May 2024
    April 2024
    March 2024
    February 2024
    January 2024
    December 2023
    November 2023
    October 2023
    September 2023
    August 2023
    July 2023
    June 2023
    May 2023
    April 2023
    March 2023
    February 2023
    January 2023
    December 2022
    November 2022
    October 2022
    September 2022
    August 2022
    July 2022
    June 2022
    May 2022
    April 2022
    March 2022
    February 2022
    January 2022
    December 2021
    November 2021
    October 2021
    September 2021
    August 2021
    July 2021
    June 2021
    May 2021
    April 2021
    March 2021
    February 2021
    January 2021
    December 2020
    November 2020
    October 2020
    September 2020
    August 2020
    July 2020
    June 2020
    May 2020
    April 2020
    March 2020
    February 2020
    January 2020
    December 2019
    November 2019
    October 2019
    September 2019
    August 2019
    June 2019
    May 2019
    April 2019
    March 2019
    February 2019
    January 2019
    December 2018
    November 2018
    October 2018
    September 2018
    August 2018
    July 2018
    June 2018
    May 2018
    April 2018
    March 2018
    February 2018
    January 2018
    December 2017
    November 2017
    October 2017
    September 2017
    August 2017
    July 2017
    June 2017
    May 2017
    April 2017
    March 2017
    February 2017
    January 2017
    December 2016
    November 2016
    October 2016
    September 2016
    August 2016
    July 2016
    June 2016
    May 2016
    April 2016
    March 2016
    February 2016
    January 2016
    December 2015
    November 2015
    October 2015
    September 2015
    August 2015
    July 2015
    June 2015
    May 2015
    April 2015
    March 2015
    February 2015
    January 2015
    December 2014
    November 2014
    October 2014
    September 2014
    August 2014
    July 2014
    June 2014
    May 2014
    April 2014
    March 2014
    February 2014
    January 2014
    December 2013
    November 2013
    October 2013
    September 2013
    August 2013
    July 2013

    About

    This website was founded in July 2013.

    RSS Feed

    Categories

    All
    American Football
    Athletics
    Baseball
    Basketball
    Behavioural Economics
    Boxing
    Broadcasting
    Competitive Balance
    Cricket
    Cycling
    Darts
    David Butler
    Declan Jordan
    Drugs
    Ed Valentine
    Epl
    Esports
    Expenditure
    F1
    Fifa World Cup
    Finances
    Funding
    Gaa
    Gaelic Games
    Gambling
    Game Theory
    Gary Burns
    Geography
    Golf
    Greyhound Racing
    Guest Posts
    Horse Racing
    Impact Studies
    John Considine
    John Eakins
    League Of Ireland
    Location
    Media
    Mls
    Mma
    Olympics
    Participation
    Paul O'Sullivan
    Premier League
    Regulation
    Research
    Robbie Butler
    Rugby
    Simpsonomics
    Snooker
    Soccer
    Spatial Analysis
    Sporting Bodies
    Stephen Brosnan
    Swimming
    Taxation
    Teaching
    Technology
    Tennis
    Transfers
    Uefa
    Ufc
    World Cup
    Wwe

Powered by Create your own unique website with customizable templates.